
Hypothesis Test: Two Population Proportions
This video explains how to conduct a hypothesis test on two population proportions. http://mathispower4u.com
From playlist Hypothesis Test with Two Samples

Hypothesis Test: Two Population Means with Unknown Standard Deviations (2 Tailed)
This video explains how to conduct a hypothesis test with two population means with unknown standard deviations. http://mathispower4u.com
From playlist Hypothesis Test with Two Samples

Hypothesis Test: Two Population Means with Unknown Standard Deviations (Data)
This video explains how to conduct a hypothesis test on two population means with unknown standard deviations. http://mathispower4u.com
From playlist Hypothesis Test with Two Samples

2 Sample t Test v Paired t Test
Identifying the difference between situations when a 2-sample t Test is appropriate and when a paired t Test is appropriate, including the recognition of paired dependent data versus independent samples.
From playlist Unit 9: t Inference and 2-Sample Inference

One Sample t Test Framework with Gardening Example (15-3)
The one sample z test is a parametric procedure that tests whether a single sample mean is significantly different than a population mean when the standard deviation of the population (σ) is UNKNOWN. We will learn the research design for the IV and DV, the assumptions for the test, how to
From playlist Single-Sample Hypothesis Tests (z, t, & p) - WK 15 QBA 237
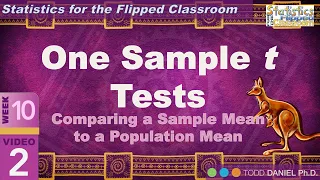
A Gentle Introduction to the One Sample t Test (10-2)
A one-sample t test will allow us to compare a sample mean to a population mean to determine if they are statistically significantly different. This video will introduce you to the fundamentals of the one-sample t test and prepare you for conducting one either by hand or using SPSS. This
From playlist WK10 One Sample t Tests - Online Statistics for the Flipped Classroom

Hypothesis Test: Two Population Means with Unknown Standard Deviations (Right Tailed)
This video explains how to conduct a hypothesis test with two population means with unknown standard deviations. http://mathispower4u.com
From playlist Hypothesis Test with Two Samples

One Sample z Test Framework with Social Media Example (15-2)
The one sample z test is a parametric procedure that tests whether a single sample mean is significantly different than a population mean when the standard deviation of the population (σ) is KNOWN. We will learn the research design for the IV and DV, the assumptions for the test, how to se
From playlist Single-Sample Hypothesis Tests (z, t, & p) - WK 15 QBA 237

Two Tail Hypothesis Test for Difference in Proportions | Statistics
We perform a two-tailed two sample z test for a difference in population proportions. This two proportion hypothesis test will require us to state our null hypothesis and alternative hypothesis, then calculate the pooled proportion to use in our standard error calculation, and then finally
From playlist Statistics

Hypothesis Testing Statistics | Hypothesis Testing in Data Science | Data Science Training | Edureka
🔥Edureka Data Science Master Program: https://www.edureka.co/masters-program/data-scientist-certification This Edureka video on "Hypothesis Testing Statistics” will provide you with a comprehensive and detailed understanding of concepts of Statistical Hypothesis Testing. Moreover, it also
From playlist Data Science Training Videos
Hypothesis testing (ALL YOU NEED TO KNOW!)
0:00 Introduction 3:41 Intuition behind hypothesis testing 10:16 Example 1 12:57 Null hypothesis 22:00 Test statistic 28:27 p-valiue 33:38 Confidence intervals 37:46 Significant treatment difference 42:25 Power and Sample size (THE BEST!) 50:47 Example 2
From playlist Statistical Inference (7 videos)

Analyze Phase In Six Sigma | Six Sigma Green Belt Training
The fourth lesson of the Lean Six Sigma Green Belt Course offered by Simplilearn. This lesson will cover the details of the analyze phase. In the Lean Six Sigma process, you begin with the define phase where you define the problem and then the current process performance is measured. Next
From playlist Six Sigma Training Videos [2022 Updated]
Python for Data Analysis: Hypothesis Testing and T-Tests
This video covers the basics of statistical hypothesis testing and t-tests in Python. This video explains the basics of statistical hypothesis testing and shows how to run one-way, two-way and paired t-tests in Python. Subscribe: ► https://www.youtube.com/c/DataDaft?sub_confirmation=1 Th
From playlist Python for Data Analysis

STAT 200 Lesson 5 Full Video Lecture
Table of Contents: 00:25 - Learning objectives 00:43 - Review: Symbols 01:59 - Hypothesis testing scenario example 02:58 - Five step hypotehsis testing procedure 04:43 - 1. Identify and write null and alternative hypotheses 08:26 - Example: Proportion broken products 10:15
From playlist STAT 200 Video Lectures

Introduction to R: T-Tests (Hypothesis Testing)
This is lesson 24 of a 30-part introduction to the R programming language for data analysis and predictive modeling. Link to the code notebook below: Intro to R: Hypothesis Testing https://www.kaggle.com/hamelg/intro-to-r-part-24-Hypothesis-Testing This lesson covers statistical hypothes
From playlist Introduction to R
STAT 200 Lesson 6 Full Lecture Video
***There is an error in the formula for the pooled standard deviation in this video from 17:17 to 27:53. The denominator should be n1+n2-2. For the correct formula and an example, see https://online.stat.psu.edu/stat200/lesson/6/6.4
From playlist STAT 200 Video Lectures
From playlist STAT 200 Video Lectures
Table of Contents: 00:50 - Lecture structure Two Proportions 01:11 - Checking assumptions 02:50 - Computing the standard error by hand 03:59 - Example: Computing the standard error for a confidence interval 06:22 - Example: Computing the standard error for a hypothesis test 08
From playlist STAT 200 Video Lectures
Statistical data analysis | Statistical Data Science | Part 1
In this course you will learn how to analyze data. #Statistic plays important role in terms of data analysis. Here you will get exposed to utilize and understand various statistical method to analyse data. The following topic has discussed in this course. - Central tendency (mean and me
From playlist Data Analysis

Null and Alternative Hypotheses in Statistics (7-8)
There are two types of hypotheses we need for hypothesis testing: the one we test (the null hypothesis) and the one that use instead if we reject the null hypothesis (the alternative hypothesis). The null hypothesis (H0) states there is no difference between the experimental (sample) mean
From playlist WK7 Sampling, Probability, & Inference - Online Statistics for the Flipped Classroom