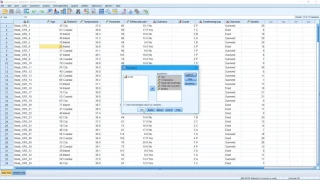
Summary statistics

Summary statistics

In descriptive statistics, summary statistics are used to summarize a set of observations, in order to communicate the largest amount of information as simply as possible. Statisticians commonly try to describe the observations in * a measure of location, or central tendency, such as the arithmetic mean * a measure of statistical dispersion like the standard mean absolute deviation * a measure of the shape of the distribution like skewness or kurtosis * if more than one variable is measured, a measure of statistical dependence such as a correlation coefficient A common collection of order statistics used as summary statistics are the five-number summary, sometimes extended to a seven-number summary, and the associated box plot. Entries in an analysis of variance table can also be regarded as summary statistics. (Wikipedia).

Summary statistics
Video thumbnail

Statistics Lecture 3.3: Finding the Standard Deviation of a Data Set

https://www.patreon.com/ProfessorLeonard Statistics Lecture 3.3: Finding the Standard Deviation of a Data Set

From playlist Statistics (Full Length Videos)

Video thumbnail

Five Number Summary (ODD)

How to find the five number summary for a set of ODD numbers. Finding min, max, median, Q1 and Q3 in simple steps.

From playlist Basic Statistics (Descriptive Statistics)

Video thumbnail

Statistics Lecture 5.2: A Study of Probability Distributions, Mean, and Standard Deviation

https://www.patreon.com/ProfessorLeonard Statistics Lecture 5.2: A Study of Probability Distributions, Mean, and Standard Deviation

From playlist Statistics (Full Length Videos)

Video thumbnail

Statistics Lecture 7.2: Finding Confidence Intervals for the Population Proportion

https://www.patreon.com/ProfessorLeonard Statistics Lecture 7.2: Finding Confidence Intervals for the Population Proportion

From playlist Statistics (Full Length Videos)

Video thumbnail

Determine if the Given Value is from a Discrete or Continuous Data Set MyMathlab Statistics

Please Subscribe here, thank you!!! https://goo.gl/JQ8Nys Determine if the Given Value is from a Discrete or Continuous Data Set MyMathlab Statistics

From playlist Statistics

Video thumbnail

Statistics Lecture 5.2 Part 1

Statistics Lecture 5.2 Part 1: Probability Distributions, Mean, and Standard Deviation

From playlist Statistics Playlist 1

Video thumbnail

Statistics Lecture 5.2 Part 2

Statistics Lecture 5.2 Part 2: Probability Distributions, Mean, and Standard Deviation

From playlist Statistics Playlist 1

Video thumbnail

05 Descriptive statistics

In this video I show you how to do simple descriptive statistics, including calculating the average and standard deviation of variables.

From playlist Healthcare statistics with SPSS

Video thumbnail

Summary Statistics

Welcome to my introductory series on Data Science! In this video, I explain how to talk about data in general, the difference between qualitative and quantitative data and finally, how to describe data succinctly by using summary statistics. Link to my notes on Introduction to Data Scien

From playlist Introduction to Data Science - Foundations

Video thumbnail

Machine learning based statistical inference - Charnock - Workshop 2 - CEB T3 2018

Tom Charnock (IAP) / 25.10.2018 Machine learning based statistical inference ---------------------------------- Vous pouvez nous rejoindre sur les réseaux sociaux pour suivre nos actualités. Facebook : https://www.facebook.com/InstitutHenriPoincare/ Twitter : https://twitter.com/InHenr

From playlist 2018 - T3 - Analytics, Inference, and Computation in Cosmology

Video thumbnail

Statistics Lecture 6.2: Introduction to the Normal Distribution and Continuous Random Variables

https://www.patreon.com/ProfessorLeonard Statistics Lecture 6.2: Introduction to the Normal Distribution and Continuous Random Variables

From playlist Statistics (Full Length Videos)

Video thumbnail

The 5-Number Summary and Box Plots in Business Statistics (Week 6C)

The five-number summary describes a distribution using the minimum, first quartile, median, third quartile, and maximum. Its graphical equivalent is the box plot. Dr. Daniel demonstrates how to create a 5-number summary and box plot in Excel and JASP. All examples use the DogToys2.xlsx (li

From playlist Basic Business Statistics (QBA 237 - Missouri State University)

Video thumbnail

Some tools for approximate Bayesian inference, Umberto Picchini - Bayes@Lund 2018

Find more info about Bayes@Lund, including slides, here: https://bayesat.github.io/lund2018/bayes_at_lund_2018.html

From playlist Bayes@Lund 2018

Video thumbnail

Using Excel to Calculate Descriptive Statistics

A Microsoft Excel tutorial on how to find: Summary Statistics 0:48 Mean 4:15 Weighted Mean 6:10 Median 8:13 Mode 9:47 Variance and Standard Deviation 11:36 Minimum, Maximum, Quartiles & Box Plots 13:13 This tutorial covers using Excel in Chapter 3 topics of Beginning Statistics, 3rd Ed, W

From playlist Using Excel in Statistics

Video thumbnail

The 5-Number Summary and BOXPLOTS (6-10)

The Five-Number Summary gives multiple measures of variability that describe the distribution. A boxplot is the graphic equivalent to a five-number summary. Both show the center and spread of the data, and boxplots can be used to identify skewness and outliers. The five numbers are: Minim

From playlist Depicting Distributions from Boxplots to z-Scores (WK 6 QBA 237)

Video thumbnail

Statistical Learning: 6.R.1 Markdown in RStudio and Best Subset Regression

Statistical Learning, featuring Deep Learning, Survival Analysis and Multiple Testing You are able to take Statistical Learning as an online course on EdX, and you are able to choose a verified path and get a certificate for its completion: https://www.edx.org/course/statistical-learning

From playlist Statistical Learning

Video thumbnail

Statistics Lecture 6.3: The Standard Normal Distribution. Using z-score, Standard Score

https://www.patreon.com/ProfessorLeonard Statistics Lecture 6.3: Applications of the Standard Normal Distribution. Using z-score, Standard Score

From playlist Statistics (Full Length Videos)

Video thumbnail

dplyr: summarize

The summarize (aka summarise) function in dplyr lets you create summary statistics from the columns of a data frame. When run on an ungrouped data frame, a summary of a column should be a single value like the mean, median, mode, etc. We will learn how to generate summary statistics on sub

From playlist dplyr in R

Related pages

Sufficient statistic | Mode (statistics) | Five-number summary | Interquartile mean | Skewness | Box plot | Analysis of variance | Statistical dispersion | Seven-number summary | Interquartile range | Median | L-moment | Range (statistics) | Variance | Central tendency | Spearman's rank correlation coefficient | Standard deviation | Descriptive statistics | Arithmetic mean | Mean absolute difference | Distance correlation | Kurtosis | Test statistic | Coefficient of variation