10b Data Analytics: Spatial Continuity
Lecture on the impact of spatial continuity to motivate characterization and modeling of spatial continuity.
From playlist Data Analytics and Geostatistics

21b Spatial Data Analytics: Dispersion Variance
Subsurface modeling course lecture on dispersion variance.
From playlist Spatial Data Analytics and Modeling

10c Data Analytics: Variogram Introduction
Lecture on the variogram as a measure to quantify spatial continuity.
From playlist Data Analytics and Geostatistics
01c Spatial Data Analytics: Modeling Goals
A lecture on subsurface modeling goals.
From playlist Spatial Data Analytics and Modeling
21 Spatial Data Analytics: Spatial Scale
Subsurface modeling course lecture on scale.
From playlist Spatial Data Analytics and Modeling

01d Spatial Data Analytics: Modeling Strategies
A lecture on spatial, subsurface modeling strategies and workflows.
From playlist Spatial Data Analytics and Modeling

01b Spatial Data Analytics: Subsurface Data
Lecture of the data available for subsurface modeling.
From playlist Spatial Data Analytics and Modeling

22 Spatial Data Analytics: Decision Making
Spatial data analytics course lecture on optimum decision making in the presence of uncertainty.
From playlist Spatial Data Analytics and Modeling
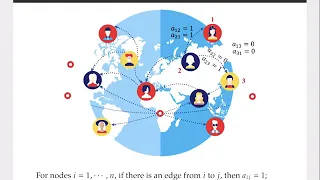
Tao Zou - Network Influence Analysis
Dr Tao Zou (ANU) presents "Network Influence Analysis”, 20 August 2020. Seminar organised by the Australian National University.
From playlist Statistics Across Campuses

Regional Climate Projections and High-Resolution Economic Modeling
Tony Smith, Yale, delivers a lecture entitled, "Regional Climate Projections and High-Resolution Economic Modeling", during the YCEI conference, "Uncertainty in Climate Change: A Conversation with Climate Scientists and Economists". More at yale.edu
From playlist Uncertainty in Climate Change: A Conversation with Climate Scientists and Economists

Impact of interannual climate variability... - Groth - Workshop 3 - CEB T3 2019
Groth (UCLA, ENS) / 04.12.2019 Impact of interannual climate variability on the agricultural sector in the Sahel region ---------------------------------- Vous pouvez nous rejoindre sur les réseaux sociaux pour suivre nos actualités. Facebook : https://www.facebook.com/InstitutHen
From playlist 2019 - T3 - The Mathematics of Climate and the Environment
Data Science - Part XVI - Fourier Analysis
For downloadable versions of these lectures, please go to the following link: http://www.slideshare.net/DerekKane/presentations https://github.com/DerekKane/YouTube-Tutorials This lecture provides an overview of the Fourier Analysis and the Fourier Transform as applied in Machine Learnin
From playlist Data Science

40 - Poisson model: crime count example introduction
This video provides an introduction to a use of Bayesian inference with a Poisson likelihood function, which we will use for the next few videos to examine the posterior distribution, as well as the prior and posterior predictive distributions, when a gamma prior is assumed. If you are in
From playlist Bayesian statistics: a comprehensive course

Jean-Pierre Florens: Inverse problems in econometrics - Lecture 1/4
Recording during the thematic month on statistics - Week 2 : "Mathematical statistics and inverse problems" the 9 February, 2016 at the Centre International de Rencontres Mathématiques (Marseille, France) Filmmaker: Guillaume Hennenfent Find this video and other talks given by worldwide
From playlist Probability and Statistics
01 Spatial Data Analytics: Subsurface Modeling
Lecture discussing the concept of subsurface modeling, integrating information sources, quantification over volume and properties of interest for decision support.
From playlist Spatial Data Analytics and Modeling
Threshold Switching Models | Switching Models in Econometrics, Part 2
This is the second video in a two-part series that shows how to model time series data in the presence of regime shifts in MATLAB in this video, we use Threshold Switching Models from the Econometrics Toolbox to model inflation data across different inflationary regimes. Download the code
From playlist Switching Models in Econometrics
Markov Switching Models | Switching Models in Econometrics, Part 1
This is the first video in a two-part series that shows how to model time series data in the presence of regime shifts in MATLAB. In this video, William Mueller uses Markov switching models from the Econometrics Toolbox to model unemployment data across different economic regimes. Downloa
From playlist Switching Models in Econometrics

Introduction to Econometrics Toolbox in MATLAB
Get a Free Trial: https://goo.gl/C2Y9A5 Get Pricing Info: https://goo.gl/kDvGHt Ready to Buy: https://goo.gl/vsIeA5 Create a predictive time-series model of a stock index. For more videos, visit http://www.mathworks.com/products/econometrics/examples.html
From playlist Computational Finance
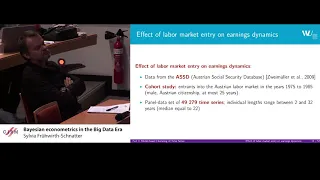
Sylvia Frühwirth-Schnatter: Bayesian econometrics in the Big Data Era
Abstract: Data mining methods based on finite mixture models are quite common in many areas of applied science, such as marketing, to segment data and to identify subgroups with specific features. Recent work shows that these methods are also useful in micro econometrics to analyze the beh
From playlist Probability and Statistics
14 Data Analytics: Indicator Methods
Lecture on the use of indicators for spatial estimation and simulation.
From playlist Data Analytics and Geostatistics