Curve fitting | Parametric statistics | Regression analysis
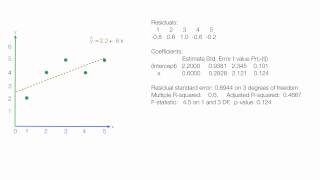
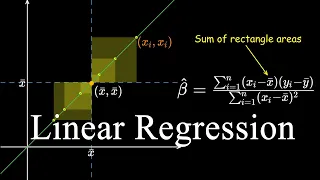
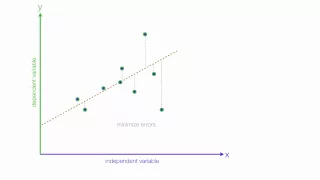
In statistics, simple linear regression is a linear regression model with a single explanatory variable. That is, it concerns two-dimensional sample points with one independent variable and one dependent variable (conventionally, the x and y coordinates in a Cartesian coordinate system) and finds a linear function (a non-vertical straight line) that, as accurately as possible, predicts the dependent variable values as a function of the independent variable.The adjective simple refers to the fact that the outcome variable is related to a single predictor. It is common to make the additional stipulation that the ordinary least squares (OLS) method should be used: the accuracy of each predicted value is measured by its squared residual (vertical distance between the point of the data set and the fitted line), and the goal is to make the sum of these squared deviations as small as possible. Other regression methods that can be used in place of ordinary least squares include least absolute deviations (minimizing the sum of absolute values of residuals) and the Theil–Sen estimator (which chooses a line whose slope is the median of the slopes determined by pairs of sample points). Deming regression (total least squares) also finds a line that fits a set of two-dimensional sample points, but (unlike ordinary least squares, least absolute deviations, and median slope regression) it is not really an instance of simple linear regression, because it does not separate the coordinates into one dependent and one independent variable and could potentially return a vertical line as its fit. The remainder of the article assumes an ordinary least squares regression.In this case, the slope of the fitted line is equal to the correlation between y and x corrected by the ratio of standard deviations of these variables. The intercept of the fitted line is such that the line passes through the center of mass (x, y) of the data points. (Wikipedia).
How to calculate Linear Regression using R. http://www.MyBookSucks.Com/R/Linear_Regression.R http://www.MyBookSucks.Com/R Playlist http://www.youtube.com/playlist?list=PLF596A4043DBEAE9C
From playlist Linear Regression.
Simple Linear Regression Formula, Visualized | Ch.1
In this video, I will guide you through a really beautiful way to visualize the formula for the slope, beta, in simple linear regression. In the next few chapters, I will explain the regression problem in the context of linear algebra, and visualize linear algebra concepts like least squa
From playlist From Linear Regression to Linear Algebra
An Introduction to Linear Regression Analysis
Tutorial introducing the idea of linear regression analysis and the least square method. Typically used in a statistics class. Playlist on Linear Regression http://www.youtube.com/course?list=ECF596A4043DBEAE9C Like us on: http://www.facebook.com/PartyMoreStudyLess Created by David Lon
From playlist Linear Regression.
An introduction to Regression Analysis
Regression Analysis, R squared, statistics class, GCSE Like us on: http://www.facebook.com/PartyMoreStudyLess Related Videos Playlist on Linear Regression http://www.youtube.com/playlist?list=PLF596A4043DBEAE9C Using SPSS for Multiple Linear Regression http://www.youtube.com/playlist?li
From playlist Linear Regression.
Simple Linear Regression | Lê Nguyên Hoang
This video explains simple linear regression. Speaker and edition: Lê Nguyên Hoang. https://www.youtube.com/playlist?list=PLie7a1OUTSagZB9mFZnVBgsNfBtcUGJWB
From playlist Data Science
Linear regression is used to compare sets or pairs of numerical data points. We use it to find a correlation between variables.
From playlist Learning medical statistics with python and Jupyter notebooks
Least squares method for simple linear regression
In this video I show you how to derive the equations for the coefficients of the simple linear regression line. The least squares method for the simple linear regression line, requires the calculation of the intercept and the slope, commonly written as beta-sub-zero and beta-sub-one. Deriv
From playlist Machine learning
(ML 9.2) Linear regression - Definition & Motivation
Linear regression arises naturally from a sequence of simple choices: discriminative model, Gaussian distributions, and linear functions. A playlist of these Machine Learning videos is available here: http://www.youtube.com/view_play_list?p=D0F06AA0D2E8FFBA
From playlist Machine Learning
From playlist Coursera Regression V2
Table of Contents: 01:19 - 1. Construct a scatterplot using ME and 02:04 - Scatterplot in Minitab Express 04:09 - 2. Identify the explanatory and response 06:35 - 3. Identify situations in which correlat 09:58 - 4. Compute Pearson r using Minitab Expre 15:28 - Correlation in
From playlist STAT 200 Video Lectures
How to do Simple Linear Regression by Hand (14-4)
Simple Linear Regression is used to predict the value of an output variable from a predictor variable. Although it is unlikely that you will be calculating many regression equations by hand, doing an example by hand is a great way to really understand regression. We will begin with the ass
From playlist WK14 Linear Regression - Online Statistics for the Flipped Classroom
Regression Analysis | Data Science Tutorial | Simplilearn
🔥 Advanced Certificate Program In Data Science: https://www.simplilearn.com/pgp-data-science-certification-bootcamp-program?utm_campaign=RegressionAnalysis-DtOYBxi4AIE&utm_medium=DescriptionFirstFold&utm_source=youtube 🔥 Data Science Bootcamp (US Only): https://www.simplilearn.com/data-sci
Multiple Regression, Clearly Explained!!!
This video directly follows part 1 in the StatQuest series on General Linear Models (GLMs) on Linear Regression https://youtu.be/nk2CQITm_eo . This StatQuest shows how the exact same principles from "simple" linear regression also apply multiple regression. At the end, I show how to test i
From playlist StatQuest
EXTRA MATH 11D: Extended regression modelling: Multiple input, non-linear relations and categorical/
Forelæsning med Per B. Brockhoff. Kapitler: 00:00 - Linear; 06:40 - Non-Linear; 09:00 - Non-Linear Regression; 11:25 - Models For Categorical Data;
From playlist DTU: Introduction to Statistics | CosmoLearning.org
Lecture 03 -The Linear Model I
The Linear Model I - Linear classification and linear regression. Extending linear models through nonlinear transforms. Lecture 3 of 18 of Caltech's Machine Learning Course - CS 156 by Professor Yaser Abu-Mostafa. View course materials in iTunes U Course App - https://itunes.apple.com/us/c
From playlist Machine Learning Course - CS 156
Simple Linear Regression(Part A)
Regression Analysis by Dr. Soumen Maity,Department of Mathematics,IIT Kharagpur.For more details on NPTEL visit http://nptel.ac.in
From playlist IIT Kharagpur: Regression Analysis | CosmoLearning.org Mathematics
JASP - Simple Linear Regression
Lecturer: Dr. Erin M. Buchanan Spring 2020 Simple linear regression is an extension of correlation - but also learn about how to understand and interpret multiple linear regression, the regression assumptions, and more! Learn more and find our documents on our OSF page: https://osf.io/t5
From playlist Learn JASP + Statistics
Fundamental Machine Learning Algorithms - Linear Regression
The code is accessible at https://github.com/sepinouda/Machine-Learning/
From playlist Machine Learning Course
QRM 6-2: TS for RM 1 (detrending)
Welcome to Quantitative Risk Management (QRM). How to detrend a time series? Why is it important? Better to use linear regression or to rely on first differences? Let us see together. The R Notebook is available here: https://www.dropbox.com/s/xmjbt6qlb9f9j67/Lesson6.Rmd And here the pd
From playlist Quantitative Risk Management