Statistical forecasting | Regression with time series structure | Change detection
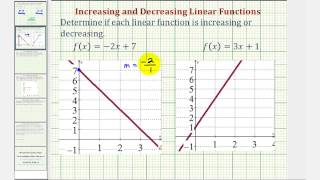
Linear trend estimation
Linear trend estimation is a statistical technique to aid interpretation of data. When a series of measurements of a process are treated as, for example, a sequences or time series, trend estimation can be used to make and justify statements about tendencies in the data, by relating the measurements to the times at which they occurred. This model can then be used to describe the behaviour of the observed data, without explaining it. In particular, it may be useful to determine if measurements exhibit an increasing or decreasing trend which is statistically distinguished from random behaviour. Some examples are determining the trend of the daily average temperatures at a given location from winter to summer, and determining the trend in a global temperature series over the last 100 years. In the latter case, issues of homogeneity are important (for example, about whether the series is equally reliable throughout its length). (Wikipedia).