Theory of probability distributions
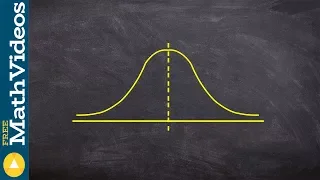
In statistics, the concept of the shape of a probability distribution arises in questions of finding an appropriate distribution to use to model the statistical properties of a population, given a sample from that population. The shape of a distribution may be considered either descriptively, using terms such as "J-shaped", or numerically, using quantitative measures such as skewness and kurtosis. Considerations of the shape of a distribution arise in statistical data analysis, where simple quantitative descriptive statistics and plotting techniques such as histograms can lead on to the selection of a particular family of distributions for modelling purposes. (Wikipedia).
Statistics: Introduction to the Shape of a Distribution of a Variable
This video introduces some of the more common shapes of distributions http://mathispower4u.com
From playlist Statistics: Describing Data
Uniform Probability Distribution Examples
Overview and definition of a uniform probability distribution. Worked examples of how to find probabilities.
From playlist Probability Distributions
Identifying, symmetric, skewed, uniform, and bell-shaped distributions
From playlist Unit 1: Descriptive Statistics
Distribution, Mean, Median, Mode, Range and Standard Deviation Lesson
This is part 1 of a lesson on describing data.
From playlist The Normal Distribution
How to find the probability from a histogram
π Learn how to find probability from a normal distribution curve. A set of data are said to be normally distributed if the set of data is symmetrical about the mean. The shape of a normal distribution curve is bell-shaped. The normal distribution curve is such that the mean is at the cente
From playlist Statistics
Find the probability of an event using a normal distribution curve
π Learn how to find probability from a normal distribution curve. A set of data are said to be normally distributed if the set of data is symmetrical about the mean. The shape of a normal distribution curve is bell-shaped. The normal distribution curve is such that the mean is at the cente
From playlist Statistics
How to find the probability using a normal distribution curve
π Learn how to find probability from a normal distribution curve. A set of data are said to be normally distributed if the set of data is symmetrical about the mean. The shape of a normal distribution curve is bell-shaped. The normal distribution curve is such that the mean is at the cente
From playlist Statistics
Learn how to find the probability from a histogram
π Learn how to find probability from a normal distribution curve. A set of data are said to be normally distributed if the set of data is symmetrical about the mean. The shape of a normal distribution curve is bell-shaped. The normal distribution curve is such that the mean is at the cente
From playlist Statistics
Central Limit Theorem - Sampling Distribution of Sample Means - Stats & Probability
This statistics video tutorial provides a basic introduction into the central limit theorem. It explains that a sampling distribution of sample means will form the shape of a normal distribution regardless of the shape of the population distribution if a large enough sample is taken from
From playlist Statistics
CSE 519 -- Lecture 11, Fall 2020
From playlist CSE 519 -- Fall 2020
Probability Density Function With Example | Probability And Statistics Tutorial | Simplilearn
π₯ Advanced Certificate Program In Data Science: https://www.simplilearn.com/pgp-data-science-certification-bootcamp-program?utm_campaign=ProbabilityDensityFunction-4FP6B5SrqKw&utm_medium=Descriptionff&utm_source=youtube π₯ Data Science Bootcamp (US Only): https://www.simplilearn.com/data-sc
Excel Statistical Analysis 32: Bell Curve Functions: NORM.DIST, NORM.S.DIST, NORM.INV, NORM.S.INV
Download Excel File: https://excelisfun.net/files/Ch06-ESA.xlsm PDF notes file: https://excelisfun.net/files/Ch06-ESA.pdf Learn about the Normal (Bell) Probability Distribution and the Excel worksheet functions to calculate probability and x values: NORM.DIST, NORM.S.DIST, NORM.INV, NORM.
From playlist Excel Statistical Analysis for Business Class Playlist of Videos from excelisfun
05 Data Analytics: Parametric Distributions
Lecture on parametric distributions, examples and applications. Follow along with the demonstration workflows in Python: o. Interactive visualization of parametric distributions: https://github.com/GeostatsGuy/PythonNumericalDemos/blob/master/Interactive_ParametricDistributions.ipynb o.
From playlist Data Analytics and Geostatistics
Introduction to FPP (Lecture 2) by Jack Thomas Hanson,
PROGRAM : FIRST-PASSAGE PERCOLATION AND RELATED MODELS (HYBRID) ORGANIZERS : Riddhipratim Basu (ICTS-TIFR, India), Jack Hanson (City University of New York, US) and Arjun Krishnan (University of Rochester, US) DATE : 11 July 2022 to 29 July 2022 VENUE : Ramanujan Lecture Hall and online T
From playlist First-Passage Percolation and Related Models 2022 Edited
Excel Statistics 68: Normal (Bell) & Standard Normal Characteristics
Download Excel File: https://people.highline.edu/mgirvin/AllClasses/210M/Content/ch06/Busn210ch06.xls Download pdf notes: https://people.highline.edu/mgirvin/AllClasses/210M/Content/ch06/Busn210Ch06.pdf Topics for Continuous Probability Distributions:: 1.See Dynamic Chart examples of th
From playlist Excel Statistics B. 06: Continuous Probability Distributions
Cumulative Distribution Functions and Probability Density Functions
This statistics video tutorial provides a basic introduction into cumulative distribution functions and probability density functions. The probability density function or pdf is f(x) which describes the shape of the distribution. It can tell you if you have a uniform, exponential, or nor
From playlist Statistics
Excel 2010 Statistics 56: Normal (Bell) & Standard Normal Characteristics
Download Excel File: https://people.highline.edu/mgirvin/AllClasses/210Excel2010/Content/Ch06/Busn210ch06.xlsm Download pdf file: https://people.highline.edu/mgirvin/AllClasses/210Excel2010/Content/Ch06/Busn210Ch06.pdf Topics for Continuous Probability Distributions:: 1. See Dynamic Char
From playlist Excel 2010 Statistics Formulas Functions Charts PivotTables
Multivariate Gaussian distributions
Properties of the multivariate Gaussian probability distribution
From playlist cs273a
Learning to find the probability using normal distribution
π Learn how to find probability from a normal distribution curve. A set of data are said to be normally distributed if the set of data is symmetrical about the mean. The shape of a normal distribution curve is bell-shaped. The normal distribution curve is such that the mean is at the cente
From playlist Statistics