
Chapter19_Comparing_categorical_data
In this lesson we will consider analysis of categorical data.
From playlist Learning medical statistics with python and Jupyter notebooks

In this lesson we take a look at comparing categorical data with tests such as the chi-square test.
From playlist Learning medical statistics with python and Jupyter notebooks
Excel Statistical Analysis 01: Data & Statistics
Download Excel File: https://excelisfun.net/files/Ch01-ESA.xlsm Topics in video: (00:00) Introduction (00:54) Use File Explorer, Show File Extensions, Create Folder for class (02:59) Use People Web Site to download files for this class (05:58) How to open Excel files using File Explorer (0
From playlist Excel Statistical Analysis for Business Class Playlist of Videos from excelisfun

From playlist Exploratory Data Analysis

Excel 2013 Statistical Analysis #5 Data Categorical, Quantitative, Nominal, Ordinal, Interval, Ratio
Download files: https://people.highline.edu/mgirvin/AllClasses/210Excel2013/Ch01/Excel2013StatisticsCh01.xlsm Topics in this video: 1. (00:43) Categorical Data vs. Quantitative Data 2. (02:00) Scales of Measurement (Levels of Measurement): Nominal, Ordinal, Interval, Ratio 3. (14:42) Cross
From playlist Excel for Statistical Analysis in Business & Economics Free Course at YouTube (75 Videos)

Statistics Lecture 3.3: Finding the Standard Deviation of a Data Set
https://www.patreon.com/ProfessorLeonard Statistics Lecture 3.3: Finding the Standard Deviation of a Data Set
From playlist Statistics (Full Length Videos)

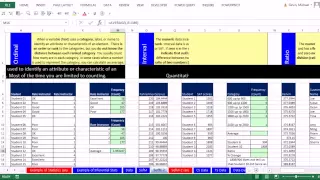
Excel Statistical Analysis 05: Frequency Distributions & Visualizations for Categorical Data
Download Excel File: https://excelisfun.net/files/Ch02-ESA.xlsm Learn about creating Frequency Distributions & Column and Bar Chart Visualizations for Categorical Data. See an Epic Summary of EVERYTHING you need to know about Column and Bar Charts. Topics: 1. (00:00) 2. (00:22) Download Ex
From playlist Excel Statistical Analysis for Business Class Playlist of Videos from excelisfun

Explore and Summarize Categorical (Nominal or Ordinal) Data in SPSS (Ep.5)
We dive deeper into exploring and summarizing categorical data with SPSS. We review levels of measurement so you can determine what kinds of data you have. Both nominal and ordinal are categorical variables because they each have limited number of distinct categories, but that ordinal data
From playlist Introduction to SPSS Statistics 27

R & Python - Correspondence Analysis
Lecturer: Dr. Erin M. Buchanan Harrisburg University of Science and Technology This lecture covers correspondence analysis in R and Python including chi-square, multiple, and simple correspondence analysis. Lecture materials and assignment available at statstools.com.
From playlist Natural Language Processing
R - Multinomial Logisitic Regression Example
Lecturer: Dr. Erin M. Buchanan Missouri State University Spring 2018 This video replaces a previous live in-class video. You will learn about how to analyze a multinomial logistic regression. We start by exploring power using G*Power, then the simple data screening required for log regre
From playlist Learn and Use G*Power

R Programming Tutorial - Learn the Basics of Statistical Computing
Learn the R programming language in this tutorial course. This is a hands-on overview of the statistical programming language R, one of the most important tools in data science. 💻Course Files: https://drive.google.com/drive/folders/15U8WjVKbYXaq6N6Wb_6bCr9QZ1DwCkAO 💻 Course created by Ba
From playlist Data Science

Introduction to Statistics with SPSS 27 for Beginners (with Puppies) (1 of 8)
Welcome to an updated version of Statistics for Beginners using SPSS 27. If you need to learn how to use IBM SPSS Statistics 27.0.1 for academics, you have found the right videos. My goal is to get you familiar with SPSS – not simply how to run a particular test – but how to be really good
From playlist Introduction to Statistics with IBM SPSS 27 for Beginners (with Puppies)

SPSS - Mediation with PROCESS Categorical Variables (Model 4)
Lecturer: Dr. Erin M. Buchanan Missouri State University Summer 2018 You will learn how to use the new version of the PROCESS version 3 plug in for SPSS by A Hayes with model 4. In this video, you will learn how to run a simple mediation model with categorical X variables, as well as dat
From playlist Mediation and Moderation

Lecturer: Dr. Erin M. Buchanan Missouri State University Spring 2017 This video covers all the tests available in the course so you can have a better idea of which ones to pick. Lecture materials and assignment available at statstools.com.
From playlist Advanced Statistics Videos

Lecturer: Dr. Erin M. Buchanan Summer 2020 https://www.patreon.com/statisticsofdoom This video is part of my human language modeling class - this video set covers the updated version with both R and Python. This video covers cluster analysis focusing on how to group together features of
From playlist Human Language (ANLY 540)
SPSS Tutorial for data analysis | SPSS for Beginners | Part 2
SPSS Statistics is a software package used for interactive, or batched, statistical analysis. Long produced by SPSS Inc., it was acquired by IBM in 2009. The current versions are named IBM SPSS Statistics. In this course you will how to use SPSS for data analysis. This #SPSS course is begi
From playlist SPSS data Analysis

R - Grammar Analysis with Logistic Regression
Lecturer: Dr. Erin M. Buchanan Harrisburg University of Science and Technology In this video, I cover a lecture from my Human Language. I go over the idea of exploring larger language models by doing an analysis to predict word choice in causative constructions. To create our models, we u
From playlist Advanced Statistics Videos

Categorical Displays: Bar Graph, Pareto Chart, Pie Chart, and Pictogram
This lesson provide an overview of ways to display categorical or qualitative data using bar graphs, Pareto charts, pie charts, and pictograms. Site: http://mathispower4u.com
From playlist Statistics: Describing Data

R - Grammar Analysis with Logistic Regression
Lecturer: Dr. Erin M. Buchanan Summer 2019 https://www.patreon.com/statisticsofdoom This video is part of my human language modeling class. This video continues with co-relations by using distinctive collexeme analysis to determine the likelihood of collocates (combinations of words). N
From playlist Human Language (ANLY 540)