
How to find df for a sample. Why we subtract 1 from a sample to get the degrees of freedom.
From playlist Hypothesis Tests and Critical Values

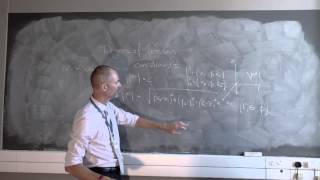
degrees of freedom Explained and Applied to a 2 Sample t Test
Calculating and understanding degrees of freedom in a 2-sample t Test or confidence interval on the difference of two means
From playlist Unit 9: t Inference and 2-Sample Inference

Degrees of Freedom – The DL on df (6-8)
This video will explain the mathematics behind why we use n -1 and what we mean by degrees of freedom. The degrees of freedom refer to how many options exist for variation in our data. Specifically, it means degrees of freedom to vary. With large samples, the degrees of freedom matter much
From playlist WK6 Measures of Variability - Online Statistics for the Flipped Classroom

From playlist STAT 501

Why are degrees of freedom (n-1) used in Variance and Standard Deviation
Tutorial on how to understand degrees of freedom and why n-1 is used instead of just n for sample variance. Includes the reason why n-1 is use for a sample, but for the population variance. Video includes a visual and numerical example. The n-1 is used to adjusted the variance because of
From playlist Standard Deviation
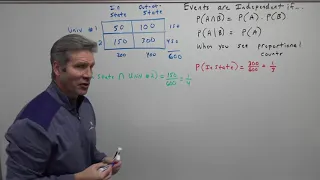
Further examination of independence
From playlist Unit 5 Probability A: Basic Probability
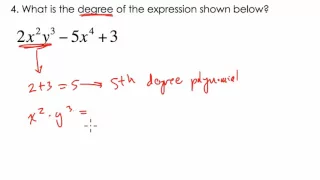
In this video we review the names of polynomials
From playlist skill 4 attempt 2

From playlist STAT 501

STAT 200 Lesson 10 Video Lecture
Table of Contents: 00:00 - Introduction 00:35 - Learning Objectives 01:02 - 1. Explain why it is not appropriate to conduct multiple independent t tests to compare the means of more than two independent groups 04:32 - 2. Use Minitab to construct a probability plot for an F distribution
From playlist STAT 200 Video Lectures
Chapter 9.2: Hypothesis Tests for Two Means: Independent Data
Chapter 9.2 from "Introduction to Statistics, Think & Do" by Scott Stevens (http://www.StevensStats.com) Textbook from Publisher, $29.95 print, $9.95 PDF http://www.centerofmathematics.com/wwcomstore/index.php/thinkdov4-1.html Textbook from Amazon: https://amzn.to/2zJRCjL
From playlist Statistics Lecture Videos

Selecting the BEST Regression Model (Part C)
Regression Analysis by Dr. Soumen Maity,Department of Mathematics,IIT Kharagpur.For more details on NPTEL visit http://nptel.ac.in
From playlist IIT Kharagpur: Regression Analysis | CosmoLearning.org Mathematics

Degrees of Freedom and Effect Sizes: Crash Course Statistics #28
Today we're going to talk about degrees of freedom - which are the number of independent pieces of information that make up our models. More degrees of freedom typically mean more concrete results. But something that is statistically significant isn't always practically significant. And to
From playlist Statistics

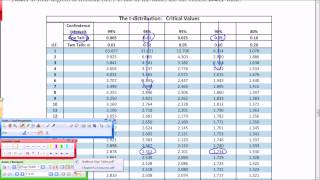
What is the t-distribution? An extensive guide!
See all my videos at http://www.zstatistics.com/videos/ 0:00 Introduction 2:17 Overview 6:06 Sampling RECAP 12:27 Visualising the t distribution 14:24 Calculating values from the t distribution (EXCEL and t-tables!)
From playlist Distributions (10 videos)
From playlist STAT 200 Video Lectures

What is the Chi-Squared distribution? Extensive video!
See all my videos at http://www.zstatistics.com/ 0:16 Introduction 2:20 History 3:21 Derivation - where does it come from? 9:40 Mean and Standard deviation 15:48 Visualisation! Changing the degrees of freedom. Note: videos on Chi-squared goodness of fit and Chi-squared test for independe
From playlist Distributions (10 videos)
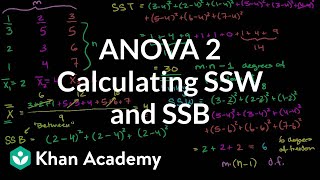
ANOVA 2: Calculating SSW and SSB (total sum of squares within and between) | Khan Academy
Courses on Khan Academy are always 100% free. Start practicing—and saving your progress—now: https://www.khanacademy.org/math/statistics-probability/analysis-of-variance-anova-library/analysis-of-variance-anova/v/anova-2-calculating-ssw-and-ssb-total-sum-of-squares-within-and-between-avi
From playlist Inferential statistics | Probability and Statistics | Khan Academy

Excel 2013 Statistical Analysis #60: T.DIST, T.DIST.RT, T.DIST.2T, T.INV, T.INV.2T functions
Download files (which file shown at begin of video): https://people.highline.edu/mgirvin/AllClasses/210Excel2013/Ch09/Ch09.htm Topics in this video: 1. (00:29) Upper Tail (Right) Test to calculate p-value and Critical Value for Hypothesis Test using T.DIST & T.DIST.RT functions for P-value
From playlist Excel for Statistical Analysis in Business & Economics Free Course at YouTube (75 Videos)

0:55 - Review #1: Frequency tables 1:27 - Review #2: Two-way contingency tables 2:24 - Review #3: Probability distribution plots 3:26 - Review #4: Conditional probabilities 5:14 - Review #5: Independence 6:08 - Lesson 11 learning objectives 6:38 - 1. Construct a chi-square probability dist
From playlist STAT 200 Video Lectures