
This video explains how to determine mean, median and mode. It also provided examples. http://mathispower4u.yolasite.com/
From playlist Statistics: Describing Data

The Normal Distribution (1 of 3: Introductory definition)
More resources available at www.misterwootube.com
From playlist The Normal Distribution

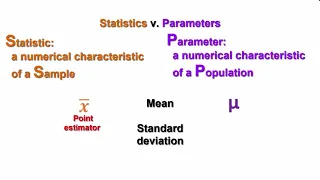
Statistic vs Parameter & Population vs Sample
This stats video tutorial explains the difference between a statistic and a parameter. It also discusses the difference between the population and sample. It includes examples such as the sample mean, population mean, sample standard deviation, population standard deviation, sample propo
From playlist Statistics
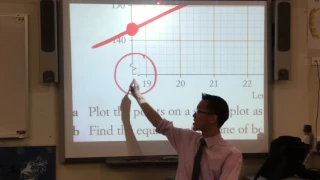
Line of Best Fit (1 of 2: Overview)
More resources available at www.misterwootube.com
From playlist Bivariate Data Analysis
sample statistics versus population parameters
From playlist Unit 1: Descriptive Statistics

A Gentle Introduction to the Normal Probability Distribution (10-4)
A normal distribution models…pretty much everything! The Normal Curve is the idealized distribution, a smooth, continuous, symmetrical line. The normal curve is used with interval and ratio scales, continuous data. The most frequent score is the middle score, less frequent scores above and
From playlist Continuous Probability Distributions in Statistics (WK 10 - QBA 237)

More resources available at www.misterwootube.com
From playlist Data Collection & Representation

More Standard Deviation and Variance
Further explanations and examples of standard deviation and variance
From playlist Unit 1: Descriptive Statistics

Understanding z-scores(standard scores) as a measure of relative standing
Please Subscribe here, thank you!!! https://goo.gl/JQ8Nys Understanding z-scores(standard scores) as a measure of relative standing. Given several z-scores, the sample mean, and the sample standard deviation, we find the values of x both with the formula and intuitively.
From playlist Statistics

One-click analysis: Detecting and visualizing insights automatically
The importance of visualizing data is universally recognized, but usually the data is passive input to some visualization tool. BeyondCore runs analytics in order to create valuable and meaningful interfaces on the data. In this video, Arijit Sengupta, CEO of BeyondCore, describes how publ
From playlist Strata Rx Conference 2013

This is an old video. See StatsMrR.com for access to hundreds of 1-3 minute, well-produced videos for learning Statistics. In this older video: An explanation and foundation for doing Chi-squared tests. Degrees of freedom and assumptions are explained. An understanding of the chi-squa
From playlist Older Statistics Videos and Other Math Videos

Arianna Renzini - Stochastic background searches in GW experiments - IPAM at UCLA
Recorded 15 November 2021. Arianna Renzini of the California Institute of Technology presents "Stochastic background searches in GW experiments" at IPAM's Workshop III: Source inference and parameter estimation in Gravitational Wave Astronomy. Abstract: The collection of individually resol
From playlist Workshop: Source inference and parameter estimation in Gravitational Wave Astronomy

Anders Södergren: On Epstein’s zeta function and related random functions
Recording during the meeting "Zeta Functions" the December 02, 2019 at the Centre International de Rencontres Mathématiques (Marseille, France) Filmmaker: Guillaume Hennenfent Find this video and other talks given by worldwide mathematicians on CIRM's Audiovisual Mathematics Library: http:
From playlist Probability and Statistics
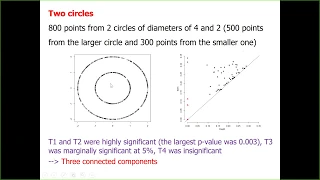
Sarit Agami (3/5/19): Modeling and replicating persistence diagrams
Title: Modeling and replicating persistence diagrams Abstract: Persistence diagrams are useful displays that give summary information about the topological features of some phenomenon. Usually, only one persistence diagram is available, and replicated persistence diagrams are needed for s
From playlist AATRN 2019

Statistical mechanics arising from random matrix theory -Thomas Spencer
50 Years of Number Theory and Random Matrix Theory Conference Topic: Statistical mechanics arising from random matrix theory Speaker: Thomas Spencer Affiliation: Institute for Advanced Study Date: June 21 2022
From playlist Mathematics
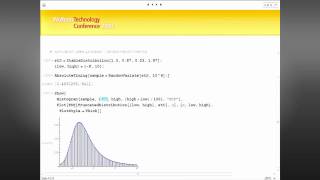
Probability & Statistics in Finance
Mathematica 8 provides a suite of high-level functions for probability and statistics. New capabilities include the ability to compute the probability of any event or the expectation of any expression, simulate any distribution, and automatically estimate parameters or test goodness of fit
From playlist Wolfram Technology Conference 2010

Lect.8B: Estimating A Variance And The Chi-Square Distribution
Lecture with Per B. Brockhoff. Chapters: 00:00 - Introduction; 01:15 - Motivating Example; 03:45 - Variacne Estimates; 06:00 - The Sampling Distribution Of The Variance;
From playlist DTU: Introduction to Statistics | CosmoLearning.org

Networks: Part 3 - Oxford Mathematics 4th Year Student Lecture
Network Science provides generic tools to model and analyse systems in a broad range of disciplines, including biology, computer science and sociology. This course (we are showing the whole course over the next few weeks) aims at providing an introduction to this interdisciplinary field o
From playlist Oxford Mathematics Student Lectures - Networks
Statistics Lecture 5.2: A Study of Probability Distributions, Mean, and Standard Deviation
https://www.patreon.com/ProfessorLeonard Statistics Lecture 5.2: A Study of Probability Distributions, Mean, and Standard Deviation
From playlist Statistics (Full Length Videos)

HYBRID EVENT Recorded during the meeting "Randoms Tensors and Related Topics" the March 15, 2022 by the Centre International de Rencontres Mathématiques (Marseille, France) Filmmaker: Guillaume Hennenfent Find this video and other talks given by worldwide mathematicians on CIRM's Audio
From playlist Probability and Statistics