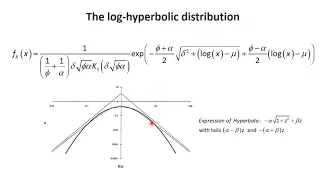
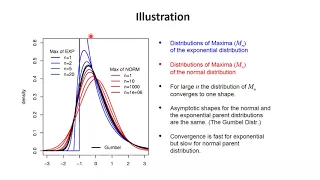
Statistical charts and diagrams
In statistics, a volcano plot is a type of scatter-plot that is used to quickly identify changes in large data sets composed of replicate data. It plots significance versus fold-change on the y and x axes, respectively. These plots are increasingly common in omic experiments such as genomics, proteomics, and metabolomics where one often has a list of many thousands of replicate data points between two conditions and one wishes to quickly identify the most meaningful changes. A volcano plot combines a measure of statistical significance from a statistical test (e.g., a p value from an ANOVA model) with the magnitude of the change, enabling quick visual identification of those data-points (genes, etc.) that display large magnitude changes that are also statistically significant. A volcano plot is constructed by plotting the negative logarithm of the p value on the y axis (usually base 10). This results in data points with low p values (highly significant) appearing toward the top of the plot. The x axis is the logarithm of the fold change between the two conditions. The logarithm of the fold change is used so that changes in both directions appear equidistant from the center. Plotting points in this way results in two regions of interest in the plot: those points that are found toward the top of the plot that are far to either the left- or right-hand sides. These represent values that display large magnitude fold changes (hence being left or right of center) as well as high statistical significance (hence being toward the top). Additional information can be added by coloring the points according to a third dimension of data (such as signal intensity), but this is not uniformly employed. Volcano plots are also used to graphically display a significance analysis of microarrays (SAM) gene selection criterion, an example of regularization. The concept of volcano plot can be generalized to other applications, where the x axis is related to a measure ofthe strength of a statistical signal, and y axis is related to a measure of the statistical significance of the signal.For example, in a genetic association case-control study, such as Genome-wide association study,a point in a volcano plot represents a single-nucleotide polymorphism.Its x value can be the logarithm of the odds ratio and its y value can be -log10 of the p value from a Chi-square testor a Chi-square test statistic. Volcano plots show a characteristic upwards two arm shape because the x axis, i.e. the underlying log2-fold changes, are generally normal distribution whereas the y axis, the log10-p values, tend toward greater significance for fold-changes that deviate more strongly from zero.The density of the normal distribution takes the form . So the of that is and the negative is which is a parabola whose arms reach upwardson the left and right sides.The upper bound of the data is one parabolaand the lower bound is another parabola. (Wikipedia).
Scatter plots using Plotly for R
This videos show the creation of scatter plots using Plotly for the R programming language. The files are available online. R-markdown: https://github.com/juanklopper/Plotly-for-R RPubs: http://rpubs.com/juanhklopper/scatter_plots_using_plotly
From playlist Statistics
Scatter plots using Plotly for Python
In this tutorial on Plotly for Python I take a look at scatter plots. They are very useful charts and plot pairs of values for two variables. Plotly actually makes is quite easy to introduce a third and even a fourth variable onto the 2D plane of a figure. Jupyter notebook files are ava
From playlist Data viz using Plotly for Python
Statistics - Making a scatter plot
This video will show you how to make a simple scatter plot. Remember to put your independent variable along the x-axis, and you dependent variable along the y-axis. For more videos please visit http://www.mysecretmathtutor.com
From playlist Statistics
Scatter Plots & Contour Plots | Introduction to Data Mining part 24
In the final video in our Data Mining Fundamentals series, we conclude our discussion of different visualization techniques for data exploration with scatter plots and contour plots. We will define each plot, and share examples of when you can use each for your data mining. -- Learn more a
From playlist Introduction to Data Mining
Subplots using Plotly for Python
In this tutorial I describe the all important process of creating more than one plot in a single figure. Plots can be placed on a grid specified by row and column size. Even these, though, can be scaled. I also show you how to scare axes and how to create odd pairings. Jupyter notebook
From playlist Data viz using Plotly for Python
Box and whisker plots in Plotly for Python
The box-and-whisker plot, or simply the box plot, is a very useful and commonly used plot. It displays the median, first and third quartile values and possible outliers of a continuous numerical variable. In this video I show you how to construct a box plot, how to change the colors and
From playlist Data viz using Plotly for Python
Chapter 6 - Box Whisker Plot - IB Math Studies (Math SL)
Hello and welcome to What Da Math This video is an introduction to box whisker plots from Chapter 6 of Haese edition of IB Math Studies book. SUBSCRIBE for more math and math studies videos Join me on Twitter: http://twitter.com/WhatDaMath
From playlist IB Math Studies Chapter 6
A first-passage-time problem for tracers in homogeneous and isotropic fluid... by Rahul Pandit
DISCUSSION MEETING : 7TH INDIAN STATISTICAL PHYSICS COMMUNITY MEETING ORGANIZERS : Ranjini Bandyopadhyay, Abhishek Dhar, Kavita Jain, Rahul Pandit, Sanjib Sabhapandit, Samriddhi Sankar Ray and Prerna Sharma DATE : 19 February 2020 to 21 February 2020 VENUE : Ramanujan Lecture Hall, ICTS
From playlist 7th Indian Statistical Physics Community Meeting 2020
Package Gadfly 04 Density plots Histograms and Violin plots for @JuliaLanguage
In this section we look at density plots, histograms and violin plots.
From playlist The Julia Computer Language
Extreme Value Statistics: distribution of maxim
From playlist Extreme Value Statistics
How 'big data' has transformed and is transforming geophysics: Professor Kathy Whaler
Kathy Whaler (University of Edinburgh, UK) Kathy Whaler has been the Professor of Geophysics at the University of Edinburgh since 1994. Her research focuses on the magnetic field of the Earth and other planets, from measurements made at the surface and by low orbiting satellites. She has
From playlist Women in data science conference
Applied Machine Learning 2019 - Lecture 23 - Basics of Time Series
Time series formats and tasks Stationarity Seasonal Models Autoregressive models More materials and slides on the course website: https://www.cs.columbia.edu/~amueller/comsw4995s19/schedule/
From playlist Applied Machine Learning - Spring 2019
The challenge of Climate Prediction: Scientific Certainty and Uncertainty by R. Saravanan
THE CHALLENGE OF CLIMATE PREDICTION: SCIENTIFIC CERTAINTY AND UNCERTAINTY SPEAKER: R. Saravanan (Texas A&M University, USA) DATE & TIME: Monday, 07 February 2022, 15:30 to 17:00 VENUE: Online Colloquium RESOURCES ABSTRACT Dealing with climate change is among the greatest problems we
From playlist ICTS Colloquia
Distribution plots using Plotly for Python
In this tutorial I take a look at distribution plots in Plotly. They actually combine three plots into one. The first being a normal histogram, in which we can state the bin size. The second is a kernel density estimate that can be changed into a normal curve. The last is a rug plot, w
From playlist Data viz using Plotly for Python
Explorations of the statistical properties of particles in turbulent flows by Rahul Pandit
Indian Statistical Physics Community Meeting 2016 URL: https://www.icts.res.in/discussion_meeting/details/31/ DATES Friday 12 Feb, 2016 - Sunday 14 Feb, 2016 VENUE Ramanujan Lecture Hall, ICTS Bangalore This is an annual discussion meeting of the Indian statistical physics community wh
From playlist Indian Statistical Physics Community Meeting 2016
Searching For Earth-Like Planets - Andrew Howard - 3/14/2018
Earnest C. Watson Lecture by Professor Andrew Howard, "Searching For Earth-Like Planets." The search for extrasolar planets has uncovered a dizzying array of planetary systems. As part of that quest, researchers have found new planet types—lava worlds and super-Earths—as well as planets o
From playlist Caltech Watson Lecture Series
05 Data Analytics: Parametric Distributions
Lecture on parametric distributions, examples and applications. Follow along with the demonstration workflows in Python: o. Interactive visualization of parametric distributions: https://github.com/GeostatsGuy/PythonNumericalDemos/blob/master/Interactive_ParametricDistributions.ipynb o.
From playlist Data Analytics and Geostatistics
Violin plots are a hybrid of density plots and box plots that can help you get a sense of the distribution of variables. #ggplot2 #datavizualization #rprogramming Code used in this code clip: library(tidyverse) library(plotly) library(IRdisplay) data <- diamonds colors <- c("#FFFFFF",
From playlist Code Clips: R Plots