
Welcome to Quantitative Risk Management (QRM). There is so much confusion about tails, that it is time to clarify what we are speaking about. Heavy tails, long tails and fat tails are not the same thing from a statistical and probabilistic point of view. In mathematics we need to be preci
From playlist Quantitative Risk Management

Tail risk of contagious diseases: a conversation with Nassim Nicholas Taleb
In this conversation, Nassim and I speak about our paper on the tail risk of contagious diseases and other related things. The paper will be available here on Monday 25 at 5pm (CET): https://www.nature.com/articles/s41567-020-0921-x
From playlist Talks and Interviews

How Increasing Benefits Increases the Risk of Ruin
Explains why you do not decrease tail risks by increasing benefits, you decrease tail risk by decreasing tail risk. This is a very short exposition of a fallacy quite generalized, but particularly present in discussions concerning the benefits of GMO. Biologists dealing with probability ha
From playlist QUANT FINANCE TOPICS

MINI-LESSON 2: Fat Tails, a Very, Very Introductory Presentation.
What are Fat Tails? This is very introductory. See the whole book (gets technical beyond Chapter 5) https://researchers.one/articles/20.01.00018
From playlist MINI LECTURES IN PROBABILITY

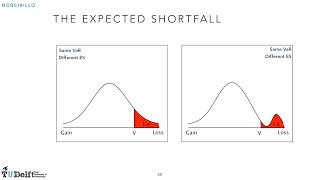
ES is a complement to value at risk (VaR). ES is the average loss in the tail; i.e., the expected loss *conditional* on the loss exceeding the VaR quantile. For more financial risk videos, visit our website! http://www.bionicturtle.com
From playlist Tail
Risk Management 5B: Value at Risk (continued) and Expected Shortfall
This is the second part of Lesson 5. Topics: - The VaR for empirical distributions - The Expected Shortfall - Coherence of VaR and ES
From playlist Risk Management

Tail risk of contagious diseases: a conversation with coauthor Pasquale Cirillo
Paper in Nature Physics on "the dog wags the tails", how pandemics are fat tailed and the implications. https://www.nature.com/articles/s41567-020-0921-x We also discuss the dangers of verbalistic users of statistical buzzwords without understanding probability s.a. BS vendor Philip Tetlo
From playlist TOPICS IN APPLIED PROBABILITY

What is Value at Risk? VaR and Risk Management
In todays video we learn about Value at Risk (VaR) and how is it calculated? Buy The Book Here: https://amzn.to/37HIdEB Follow Patrick on Twitter Here: https://twitter.com/PatrickEBoyle What Is Value at Risk (VaR)? Value at risk (VaR) is a calculation that aims to quantify the level of
From playlist Risk Management
QRM 5-1: Tails in Data - MS Plot and Concentration Profile
Welcome to Quantitative Risk Management (QRM). Let us continue our discussion about the graphical tools we can use to study tails. We will consider the very useful Max-to-Sum (MS) plot, able to tell us something about the existence of moments, and the Concentration Profile, another way of
From playlist Quantitative Risk Management
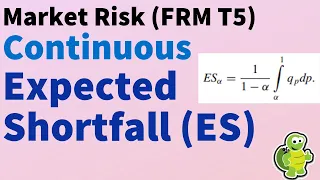
Expected shortfall: approximating continuous, with code (ES continous, FRM T5-03)
In my previous video, I showed you how we retrieve expected shortfall under the simplest possible discrete case. That was a simple historical simulation, but that was discrete. In this video, I'm going to review expected shortfall when the distribution is continuous. Specifically, I will u
From playlist Market Risk (FRM Topic 5)

This is the video of my talk at the Conference on Complex Systems 2020 (CCS2020), in the satellite event organised by Alfredo J. Morales (MIT) and Rosa M. Benito (Technical University of Madrid). For privacy reasons, I have cut the video, not to show the pictures of the other participants
From playlist Talks and Interviews
Level 1 Chartered Financial Analyst (CFA ®): Measures of dispersion including volatility
Session 2, Reading 8 (Part 2): A previous video in this CFA playlist looked at classic measures of central tendency. This is also called the first moment of the distribution or the distributions the location where is the distribution centered. When we say that I think most of us think of t
From playlist Level 1 Chartered Financial Analyst (CFA ®) Volume 1

Environment oblivious risk-aware bandit algorithms by Jayakrishnan Nair
PROGRAM: ADVANCES IN APPLIED PROBABILITY ORGANIZERS: Vivek Borkar, Sandeep Juneja, Kavita Ramanan, Devavrat Shah, and Piyush Srivastava DATE & TIME: 05 August 2019 to 17 August 2019 VENUE: Ramanujan Lecture Hall, ICTS Bangalore Applied probability has seen a revolutionary growth in resear
From playlist Advances in Applied Probability 2019

Expected shortfall (ES, FRM T5-02)
In this video, I'm going to show you exactly how we calculate expected shortfall under basic historical simulation. Expected shortfall is both desirable and timely. It's desirable because it is coherent, satisfies all four conditions of coherence, including subadditivity, whereas var does
From playlist Market Risk (FRM Topic 5)

Kurtosis of a probability distribution (FRM T2-7)
[Here is my xls http://trtl.bz/121817-yt-kurtosis-xls] Kurtosis is the standardized fourth central moment and is a measure of tail density; e.g., heavy or fat-tails. Heavy-tailedness also tends to correspond to high peakedness. Excess kurtosis (aka, leptokurtosis) is given by (kurtosis-3).
From playlist Quantitative Analysis (FRM Topic 2)

Excel Statistics 88: Confidence Interval & Hypothesis Tests
Download Excel File: https://people.highline.edu/mgirvin/AllClasses/210M/Content/Ch09/Busn210ch09.xls Download pdf notes: https://people.highline.edu/mgirvin/AllClasses/210M/Content/Ch09/Busn210Ch09001.pdf See the Excel functions NORMSINV for critical value and NORSDIST for p-value. Compa
From playlist Excel 2007 Statistics: Charts, Functions, Formulas

QRM L2-2: Value-at-Risk and Expected Shortfall
Welcome to Quantitative Risk Management (QRM). In this video we briefly introduce VaR and ES. Please notice that many concepts are given for granted, and, in case you need more basic details, I refer you to extra videos (check the links appearing on screen). We shall see that ES is always
From playlist Quantitative Risk Management

Welcome to Quantitative Risk Management (QRM). In this lesson, we play with R to deal with VaR and ES. We show how to compute them empirically, but also in the case of normality. We then show that normality tends to underestimate tail risk, as observable in actual financial data. The pdf
From playlist Quantitative Risk Management

QRM 5-2: The problem of estimating the tail
Welcome to Quantitative Risk Management (QRM). Let us finish our discussion about the graphical tools we can use to study tails. We briefly discuss the Moment Ratio Plot and the Zenga Plot. After that we address the problem of estimating the tail parameter, using MLE and other approaches.
From playlist Quantitative Risk Management