
What is a (mathematical) model?
"Model" is a vague term that means different things in different contexts. Here I clear it all up in the context of statistics! For a complete index of all the StatQuest videos, check out: https://statquest.org/video-index/ If you'd like to support StatQuest, please consider... Buying T
From playlist StatQuest

From playlist Videos for mechanics

Mean, Standard Deviation, and Variance in StatCrunch
Please Subscribe here, thank you!!! https://goo.gl/JQ8Nys Mean, Standard Deviation, and Variance in StatCrunch
From playlist StatCrunch

p-values: What they are and how to interpret them
This StatQuest is all about interpreting p-values. You've seen them online or in publications, or heard about them, whispered in dark, rave filled dance clubs, but you've never understood what they were all about. This 'Quest is here to explain everything you wanted to know about how to in
From playlist StatQuest

StatQuest: Logistic Regression
Logistic regression is a traditional statistics technique that is also very popular as a machine learning tool. In this StatQuest, I go over the main ideas so that you can understand what it is and how it is used. For a complete index of all the StatQuest videos, check out: https://statq
From playlist StatQuest
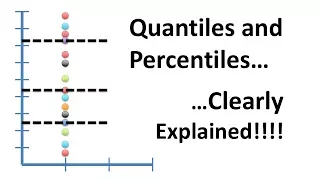
Quantiles and Percentiles, Clearly Explained!!!
Although there is a ton of conflicting information about quantiles and percentiles on the internet, this StatQuest filters out the noise and focuses and the most important things you need to know about these two summary statistics. For a complete index of all the StatQuest videos, check o
From playlist StatQuest

Hello, and welcome to StatQuest! StatQuest is about learning how to visualize and "see" how statistics work without getting too bogged down in the equations. Once you can get an image in your head of how statistics work, the equations make sense and come easy.
From playlist StatQuest

StatQuickie: Thresholds for Significance
People often ask me what a good threshold is for statistical significance. The answer is always, "It depends!" For a complete index of all the StatQuest videos, check out: https://statquest.org/video-index/ If you'd like to support StatQuest, please consider... Buying The StatQuest Illu
From playlist StatQuest

Statistics Lecture 3.3: Finding the Standard Deviation of a Data Set
https://www.patreon.com/ProfessorLeonard Statistics Lecture 3.3: Finding the Standard Deviation of a Data Set
From playlist Statistics (Full Length Videos)
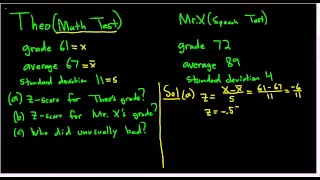
Computing z-scores(standard scores) and comparing them
Please Subscribe here, thank you!!! https://goo.gl/JQ8Nys Computing z-scores(standard scores) and comparing them
From playlist Statistics