
From playlist Videos for mechanics

StatQuest: Logistic Regression
Logistic regression is a traditional statistics technique that is also very popular as a machine learning tool. In this StatQuest, I go over the main ideas so that you can understand what it is and how it is used. For a complete index of all the StatQuest videos, check out: https://statq
From playlist StatQuest

What is a (mathematical) model?
"Model" is a vague term that means different things in different contexts. Here I clear it all up in the context of statistics! For a complete index of all the StatQuest videos, check out: https://statquest.org/video-index/ If you'd like to support StatQuest, please consider... Buying T
From playlist StatQuest

p-values: What they are and how to interpret them
This StatQuest is all about interpreting p-values. You've seen them online or in publications, or heard about them, whispered in dark, rave filled dance clubs, but you've never understood what they were all about. This 'Quest is here to explain everything you wanted to know about how to in
From playlist StatQuest
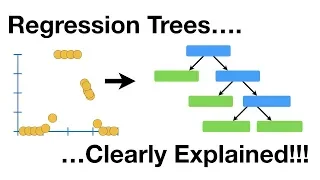
Regression Trees, Clearly Explained!!!
Regression Trees are one of the fundamental machine learning techniques that more complicated methods, like Gradient Boost, are based on. They are useful for times when there isn't an obviously linear relationship between what you want to predict, and the things you are using to make the p
From playlist StatQuest
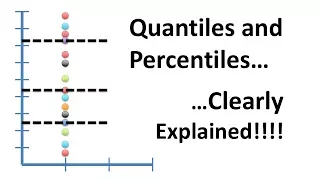
Quantiles and Percentiles, Clearly Explained!!!
Although there is a ton of conflicting information about quantiles and percentiles on the internet, this StatQuest filters out the noise and focuses and the most important things you need to know about these two summary statistics. For a complete index of all the StatQuest videos, check o
From playlist StatQuest

Design Matrices For Linear Models, Clearly Explained!!!
In order to use general linear models (GLMs) you need to create design matrices. At first, these can seem intimidating, but this StatQuest puts together a bunch of examples and illustrates them all so that they are clearly explained. The examples in this video are worked out in R in this v
From playlist StatQuest

The Main Ideas of Fitting a Line to Data (The Main Ideas of Least Squares and Linear Regression.)
Fitting a line to data is actually pretty straightforward. For a complete index of all the StatQuest videos, check out: https://statquest.org/video-index/ If you'd like to support StatQuest, please consider... Buying The StatQuest Illustrated Guide to Machine Learning!!! PDF - https://s
From playlist StatQuest

The Difference Between Technical and Biological Replicates
You can't do statistics without replication and in the biological sciences, there are two main types of replication: technical and biological. This StatQuest explains the differences between these two types of replication and dive into some subtleties and grey areas, too. For a complete i
From playlist StatQuest

StatQuest: Linear Models Pt.3 - Design Matrices (old version)
NOTE: There is a new and updated version of this video here: https://youtu.be/CqLGvwi-5Pc In order to use general linear models (GLMs) you need to create design matrices. At first, these can seem intimidating, but I've put together a bunch of examples and illustrated them all so that they
From playlist High Throughput Sequencing