Dimension reduction | Artificial neural networks | Cluster analysis algorithms

Self-organizing map

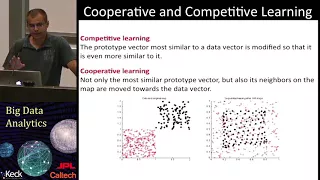
A self-organizing map (SOM) or self-organizing feature map (SOFM) is an unsupervised machine learning technique used to produce a low-dimensional (typically two-dimensional) representation of a higher dimensional data set while preserving the topological structure of the data. For example, a data set with variables measured in observations could be represented as clusters of observations with similar values for the variables. These clusters then could be visualized as a two-dimensional "map" such that observations in proximal clusters have more similar values than observations in distal clusters. This can make high-dimensional data easier to visualize and analyze. An SOM is a type of artificial neural network but is trained using competitive learning rather than the error-correction learning (e.g., backpropagation with gradient descent) used by other artificial neural networks. The SOM was introduced by the Finnish professor Teuvo Kohonen in the 1980s and therefore is sometimes called a Kohonen map or Kohonen network. The Kohonen map or network is a computationally convenient abstraction building on biological models of neural systems from the 1970s and morphogenesis models dating back to Alan Turing in the 1950s. (Wikipedia).

Self-organizing map
Video thumbnail

Emergent Patterns in Self-Organizing Maps

Submission for the 3Blue1Brown Summer of Math Exposition. https://www.3blue1brown.com/blog/some1 I explain how self-organizing maps work and discuss an interesting phenomenon that can occur when creating them. Code: https://github.com/rkharris12/som Research paper: https://ieeexplore.i

From playlist Summer of Math Exposition Youtube Videos

Video thumbnail

Iris Flower Clustering with Neural Net Clustering App

Get a Free Trial: https://goo.gl/C2Y9A5 Get Pricing Info: https://goo.gl/kDvGHt Ready to Buy: https://goo.gl/vsIeA5 Cluster iris flowers based on petal and sepal size. For more videos, visit http://www.mathworks.com/products/neural-network/examples.html

From playlist Math, Statistics, and Optimization

Video thumbnail

Intersection and union of sets 2

drawing intersection and union with geogebra. this video can help you to drawing sets.

From playlist Go Geogebra

Video thumbnail

Mind maps: GeoGebra Notes New Feature!

🎉 #GeoGebra Notes new feature! 🎉 ➡️ Create your own mind map ➡️ Format any way you like! https://www.geogebra.org/notes

From playlist New Features and Releases

Video thumbnail

Self-Driving Cars

If you are interested in learning more about this topic, please visit http://www.gcflearnfree.org/ to view the entire tutorial on our website. It includes instructional text, informational graphics, examples, and even interactives for you to practice and apply what you've learned.

From playlist Self-Driving Cars

Video thumbnail

Geogebra Tutorial : Union and Intersection of Sets

Union and intersection of sets can be drawing with geogebra. Please see the video to start how drawing union and intersection of sets. more visit https://onwardono.com

From playlist SET

Video thumbnail

Drawing Sets complete in venn diagram

drawing venn diagram with geogebra, teh video going to guide how draw venn diagram from geogebra. dont forget subscribe to others our videos

From playlist Geogebra Videos

Video thumbnail

Self-assembly: The power of organizing the unorganized - Skylar Tibbits

View full lesson: http://ed.ted.com/lessons/self-assembly-the-power-of-organizing-the-unorganized-skylar-tibbits From something as familiar as our bodies to things vast as the formation of galaxies, we can observe the process of self-assembly, or when unordered parts come together in an o

From playlist How Things Work

Video thumbnail

MountainWest Devops 2014 - "DevOps" in a Post-DevOps World by Paul Reed

Has "DevOps" jumped the shark? Some say yes; others say 2014 will be the year DevOps dons its Fonz-esque leather jacket. Whichever you believe, the marketing feeding frenzy has begun and the dilution of the "DevOps" concept to include everything (and simultaneously mean nothing) is palpabl

From playlist MountainWest DevOps 2014

Video thumbnail

Drawing Diagram Venn 1

see the video to drawing diagram venn in geogebra

From playlist SET

Video thumbnail

When Art and Analytics Overlap - Golan Levin - May 23, 2013

This talk is part of the symposium, "Data Visualization from Data to Discovery: Art Center + Caltech + JPL", May 23, 2013 | Beckman Auditorium | Caltech, Pasadena, CA, USA | http://www.hi.jpl.nasa.gov/datavis When Art and Analytics Overlap: Insights and Strategies from Artists who use Evi

From playlist Data Visualization from Data to Discovery - May 23, 2013

Video thumbnail

DDPS | Machine Learning of Self Organization from Observation by Ming Zhong

Self-organization (also known as collective behaviors) can be found in studying crystal formation, superconductivity, social behaviors, etc. It is a challenging task to understand such phenomenon from the mathematical point of view. We offer data-driven knowledge-based learning approach to

From playlist Data-driven Physical Simulations (DDPS) Seminar Series

Video thumbnail

Using Machine Learning and Breaking Rocket Motors

Let's take on Siraj Raval's 100 day challenge to learn a little bit about machine learning every day. This video explains some machine learning I've done with composite rocket motor casings using #AcousticEmissions. #100DaysOfMLCode Original Video - https://youtu.be/cuQMBj1cWPo You can

From playlist SciJoy Uploads

Video thumbnail

Random walks on Tori and normal numbers in self similar sets by Arijit Ganguly

PROGRAM SMOOTH AND HOMOGENEOUS DYNAMICS ORGANIZERS: Anish Ghosh, Stefano Luzzatto and Marcelo Viana DATE: 23 September 2019 to 04 October 2019 VENUE: Ramanujan Lecture Hall, ICTS Bangalore Ergodic theory has its origins in the the work of L. Boltzmann on the kinetic theory of gases.

From playlist Smooth And Homogeneous Dynamics

Video thumbnail

How to Create Your Own GeoGebra Activities: Remote Learning with GeoGebra (Part 2)

Here, we will learn how to 1) Create a #GeoGebra activity/resource from scratch. 2) Customize the toolbar (so students see less tools from which to choose) 3) Turn a construction made within a #GeoGebra app into a working activity/resource #EdTech #math #maths #DiscoveryLearning Link to

From playlist Remote Learning with GeoGebra

Video thumbnail

Network evolution in Immune system and Development (Lecture – 01) by Paul François

Winter School on Quantitative Systems Biology DATE:04 December 2017 to 22 December 2017 VENUE:Ramanujan Lecture Hall, ICTS, Bengaluru The International Centre for Theoretical Sciences (ICTS) and the Abdus Salam International Centre for Theoretical Physics (ICTP), are organizing a Winter S

From playlist Winter School on Quantitative Systems Biology

Related pages

Generative topographic map | Failure mode and effects analysis | Dimensionality reduction | Neural gas | Deep learning | Topology | Exploratory data analysis | Unit cube | Elastic map | Growing self-organizing map | Competitive learning | Resampling (statistics) | Feature extraction | Neocognitron | Learning rate | Approximation error | Least squares | Free module | Liquid state machine | Spline interpolation | Gaussian function | Alan Turing | Topological data analysis | Nonlinear dimensionality reduction | Gradient descent | Artificial neural network | Euclidean distance | Backpropagation