
How To Calculate The Risk Reward Ratio, Break Even Win Rate, & Expectancy of a Stock Trading System
This video explains how to calculate the risk reward ratio of a trade, how to calculate the minimum win rate or probability of winning in order to break even and the amount you expect to earn per trade on average relative to the amount at risk which is equivalent to the expectancy of a sto
From playlist Stocks and Bonds

What is Value at Risk? VaR and Risk Management
In todays video we learn about Value at Risk (VaR) and how is it calculated? Buy The Book Here: https://amzn.to/37HIdEB Follow Patrick on Twitter Here: https://twitter.com/PatrickEBoyle What Is Value at Risk (VaR)? Value at risk (VaR) is a calculation that aims to quantify the level of
From playlist Risk Management

Risk Management Lesson 5A: Exercise
This short video shows the solution of one of the exercises you find in Lesson 5A.
From playlist Risk Management
QRM L1-1: The Definition of Risk
Welcome to Quantitative Risk Management (QRM). In this first class, we define what risk if for us. We will discuss the basic characteristics of risk, underlining some important facts, like its subjectivity, and the impossibility of separating payoffs and probabilities. Understanding the d
From playlist Quantitative Risk Management

Risk Management Lesson 5A: Value at Risk
In this first part of Lesson 5, we discuss Value-at-Risk (VaR). Topics: - Definition of VaR - Loss distribution and confidence level - The normal VaR
From playlist Risk Management

Value at Risk (VaR) Backtest (FRM T5-04)
When we specify something like a 95% value at risk or 95% VaR, we mean that 95% is the confidence level and, therefore, 5% is the significance level. That means we expect on 5% of days for the actual loss to be worse than the VaR or to exceed the VaR. This video is about the backtest of a
From playlist Market Risk (FRM Topic 5)
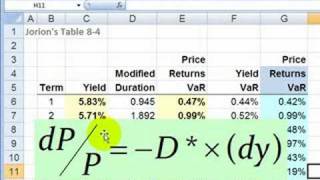
FRM: Bond returns value at risk (VaR) as bond risk
Bond risk can be measured by "price returns value at risk (VaR)" where the price returns VaR is linked to yield VaR with duration. For more financial risk videos, visit our website! http://www.bionicturtle.com
From playlist Value at Risk (VaR): VaR Mapping

FRM: Risk-adjusted performance ratios
RAPMs are variations of: return per unit of risk. Treynor and Sharpe are similar: both are excess return per unit of risk. Treynor defines risk as systematic risk (beta) and is therefore appropriate to well-diversified portfolios (i.e., into such portfolios idiosyncratic risk is eliminated
From playlist Performance measures
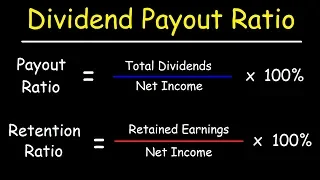
Dividends - Payout Ratio vs Retention Ratio
This stocks and bonds video tutorial explains how to calculate the dividend payout ratio and the retention ratio. The payout ratio is equal to the total dividends paid divided by the net income. The retention ratio is equal to the earnings retained divided by the net income. My Website:
From playlist Stocks and Bonds

The information ratio is active (or residual) return divided by active (or residual) risk. Active risk is also called tracking error, so the "active information ratio" is given by (active return)/(tracking error). Alternatively, a more technical approach is to use alpha (aka, residual risk
From playlist Risk Foundations (FRM Topic 1)

I Bought $500 of Stocks Using Graph Theory and the Sharpe Ratio
My Patreon : https://www.patreon.com/user?u=49277905 We invest $500 using financial data science! 0:00 Intro 2:38 Graph Theory 4:56 Sharpe Ratio 15:00 Buying the Stocks
From playlist Stock Trading Principles

Downside risk measures: semi-deviation, downside deviation, and Sortino ratio (FRM T1-12)
The two typical measures of downside risk focus on only the "bad" dispersion: Semi-deviation squares returns below the MEAN return, while downside deviation squares returns below a TARGET return (aka, minimum acceptable return, MAR). The Sortino Ratio divides by the downside deviation. [He
From playlist Risk Foundations (FRM Topic 1)

RAPMs: Treynor, Jensen's, Sharpe (FRM T1-10)
Risk-adjusted performance measures (RAPMs) include Treynor and Jensen's, both of which are functions of the CAPM/SML, and the Sharpe ratio, which can be understood in the context of the CML. [Here is my the spreadsheet I used for this video, please let me know if you have any questions htt
From playlist Risk Foundations (FRM Topic 1)

Applied Portfolio Management - Class 1 - Risk & Return
All slides are available on my Patreon page: https://www.patreon.com/PatrickBoyleOnFinance Book Suggestions: Burton Malkiel, A Random Walk Down Wall Street (2007) https://amzn.to/2Hr2SW1 Roger Lowenstein, Buffett: The Making of an American Capitalist (2008) https://amzn.to/3hUkFl6 Jack Sc
From playlist Applied Portfolio Management

Capital market line (CML) versus security market line (SML), FRM T1-8
The CML contains ONLY efficient portfolios (and plots return against volatility; aka, total risk) while the SML plots any portfolio (and plots return against beta; aka, systematic risks) including inefficient portfolios. [here is my xls https://trtl.bz/2Fru70r] 💡 Discuss this video here i
From playlist Risk Foundations (FRM Topic 1)

How the portfolio possibilities curve (PPC) illustrates the benefit of diversification (FRM T1-7)
When correlations are imperfect, diversification benefits are possible. The portfolio possibilities curve illustrates this and it contains two notable points: the minimum variance portfolio (MVP) and the optimal portfolio (with the highest Sharpe ratio). At the end, I summarize four featur
From playlist Risk Foundations (FRM Topic 1)

Lecture 18 - The Capital Assets Pricing Model
This is Lecture 18 of the COMP510 (Computational Finance) course taught by Professor Steven Skiena [http://www.cs.sunysb.edu/~skiena/] at Hong Kong University of Science and Technology in 2008. The lecture slides are available at: http://www.algorithm.cs.sunysb.edu/computationalfinance/pd
From playlist COMP510 - Computational Finance - 2007 HKUST


How do you calculate value at risk? Two ways of calculating VaR
In todays video we learn how to calculate VaR or Value at Risk. Buy The Book Here: https://amzn.to/37HIdEB Follow Patrick on Twitter Here: https://twitter.com/PatrickEBoyle What is VAR? The most popular and traditional measure of risk is volatility. The main problem with volatility, how
From playlist Risk Management