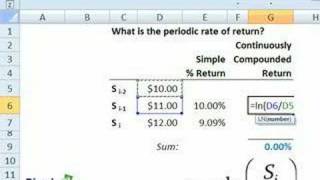
Intro to Quant Finance: Periodic Rate of Return
Periodic rate of return
From playlist Intro to Quant Finance

Determine the Total Return of an Investment as Percent
This video explains how to calculate the total return on an investment as a percent. http://mathispower4u.com
From playlist Finance: Simple and Compounded Interest

In this video, we look at a basic return on investment calculation.
From playlist Personal Finance

Annual Rate of Return Need for Loss Recover and Additional Return on Investment
This video explains what rate of return is needed to recover from a loss as well as the rate of return needed to earn a certain rate of return moving forward. https://mathispower4u.com
From playlist Finance: Simple and Compounded Interest

Return on Investment with Delta Math
In this video, we look at a return on investment practice problem on Delta Math.
From playlist Personal Finance

How To Calculate The Return on Investment (ROI) of Real Estate & Stocks
This video explains how to calculate the return on investment including the average annual ROI. Examples and practice problems include real estate and stocks. My Website: https://www.video-tutor.net Patreon Donations: https://www.patreon.com/MathScienceTutor Amazon Store: https://www.
From playlist Stocks and Bonds
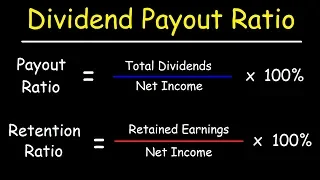
Dividends - Payout Ratio vs Retention Ratio
This stocks and bonds video tutorial explains how to calculate the dividend payout ratio and the retention ratio. The payout ratio is equal to the total dividends paid divided by the net income. The retention ratio is equal to the earnings retained divided by the net income. My Website:
From playlist Stocks and Bonds

FRM: Time-weighted versus dollar-weighted (IRR) returns
Time-weighted returns (TWR) vs Dollar-weighted returns (DWR). For more Financial Risk Management videos, visit our website at http://www.bionicturtle.com!
From playlist FRM
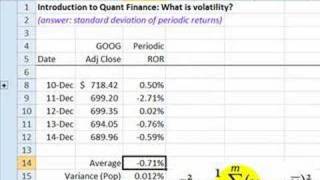
FRM: Intro to Quant Finance: Volatility
Volatility is the standard deviation of period returns. For more financial risk videos, visit our website! http://www.bionicturtle.com
From playlist Intro to Quant Finance

MIT 15.401 Finance Theory I, Fall 2008 View the complete course: http://ocw.mit.edu/15-401F08 Instructor: Andrew Lo License: Creative Commons BY-NC-SA More information at http://ocw.mit.edu/terms More courses at http://ocw.mit.edu
From playlist MIT 15.401 Finance Theory I, Fall 2008

Lecture 18 - The Capital Assets Pricing Model
This is Lecture 18 of the COMP510 (Computational Finance) course taught by Professor Steven Skiena [http://www.cs.sunysb.edu/~skiena/] at Hong Kong University of Science and Technology in 2008. The lecture slides are available at: http://www.algorithm.cs.sunysb.edu/computationalfinance/pd
From playlist COMP510 - Computational Finance - 2007 HKUST

Ses 15: Portfolio Theory III & The CAPM and APT I
MIT 15.401 Finance Theory I, Fall 2008 View the complete course: http://ocw.mit.edu/15-401F08 Instructor: Andrew Lo License: Creative Commons BY-NC-SA More information at http://ocw.mit.edu/terms More courses at http://ocw.mit.edu
From playlist MIT 15.401 Finance Theory I, Fall 2008

FRM: Security Market Line (SML)
The security market line (SML) plots the expected return of an asset (or portfolio) as a function of the asset's beta. For more financial risk videos, visit our website! http://www.bionicturtle.com
From playlist Intro to Quant Finance

Capital market line (CML) versus security market line (SML), FRM T1-8
The CML contains ONLY efficient portfolios (and plots return against volatility; aka, total risk) while the SML plots any portfolio (and plots return against beta; aka, systematic risks) including inefficient portfolios. [here is my xls https://trtl.bz/2Fru70r] 💡 Discuss this video here i
From playlist Risk Foundations (FRM Topic 1)

Ses 13: Risk and Return II & Portfolio Theory I
MIT 15.401 Finance Theory I, Fall 2008 View the complete course: http://ocw.mit.edu/15-401F08 Instructor: Andrew Lo License: Creative Commons BY-NC-SA More information at http://ocw.mit.edu/terms More courses at http://ocw.mit.edu
From playlist MIT 15.401 Finance Theory I, Fall 2008

FRM: Risk-adjusted performance ratios
RAPMs are variations of: return per unit of risk. Treynor and Sharpe are similar: both are excess return per unit of risk. Treynor defines risk as systematic risk (beta) and is therefore appropriate to well-diversified portfolios (i.e., into such portfolios idiosyncratic risk is eliminated
From playlist Performance measures

Stock Market Investing the Right Way
I explain how to create a perfect portfolio. Also I show you how a professional invests in the stock market. Don't Buy Stock if you Don't Think.
From playlist Random Videos

MIT 15.401 Finance Theory I, Fall 2008 View the complete course: http://ocw.mit.edu/15-401F08 Instructor: Andrew Lo License: Creative Commons BY-NC-SA More information at http://ocw.mit.edu/terms More courses at http://ocw.mit.edu
From playlist MIT 15.401 Finance Theory I, Fall 2008

Applied Portfolio Management - Video 4 - Fixed Income Asset Management
All slides are available on my Patreon page: https://www.patreon.com/PatrickBoyleOnFinance Fixed income refers to any type of investment under which the borrower or issuer is obliged to make payments of a fixed amount on a fixed schedule. For example, the borrower may have to pay interest
From playlist Applied Portfolio Management

RAPMs: Treynor, Jensen's, Sharpe (FRM T1-10)
Risk-adjusted performance measures (RAPMs) include Treynor and Jensen's, both of which are functions of the CAPM/SML, and the Sharpe ratio, which can be understood in the context of the CML. [Here is my the spreadsheet I used for this video, please let me know if you have any questions htt
From playlist Risk Foundations (FRM Topic 1)