Free statistical software | Time series software
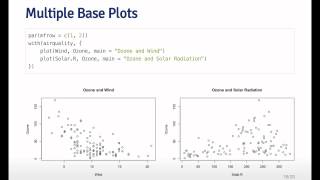
Plotly

Plotly is a technical computing company headquartered in Montreal, Quebec, that develops online data analytics and visualization tools. Plotly provides online graphing, analytics, and statistics tools for individuals and collaboration, as well as scientific graphing libraries for Python, R, MATLAB, Perl, Julia, Arduino, and REST. (Wikipedia).

Plotly
Video thumbnail

Plotly for python

In this new series I take a look at my favorite plotting library of all time. Plotly. Plotly is a cloud service for plotting. It can also be used in many programming languages, though. In this playlist I will be showing you how to use it with Python in a Jupyter notebook. The files ar

From playlist Data viz using Plotly for Python

Video thumbnail

Introduction to plotly

Plotly is an online tool used to plot data. It can be used straight from python, or as standalone tool on the web. It is almost a social media tool and can be used to collaborate with colleagues.

From playlist Learning medical statistics with python and Jupyter notebooks

Video thumbnail

Subplots using Plotly for Python

In this tutorial I describe the all important process of creating more than one plot in a single figure. Plots can be placed on a grid specified by row and column size. Even these, though, can be scaled. I also show you how to scare axes and how to create odd pairings. Jupyter notebook

From playlist Data viz using Plotly for Python

Video thumbnail

Scatter plots using Plotly for Python

In this tutorial on Plotly for Python I take a look at scatter plots. They are very useful charts and plot pairs of values for two variables. Plotly actually makes is quite easy to introduce a third and even a fourth variable onto the 2D plane of a figure. Jupyter notebook files are ava

From playlist Data viz using Plotly for Python

Video thumbnail

Scatter plots using Plotly for R

This videos show the creation of scatter plots using Plotly for the R programming language. The files are available online. R-markdown: https://github.com/juanklopper/Plotly-for-R RPubs: http://rpubs.com/juanhklopper/scatter_plots_using_plotly

From playlist Statistics

Video thumbnail

How to use Plotly in a Google Colaboratory notebook

In this notebook I show you how to use Plotly in a Google Colaboratory Jupyter notebook

From playlist Data viz using Plotly for Python

Video thumbnail

Box and whisker plots in Plotly for Python

The box-and-whisker plot, or simply the box plot, is a very useful and commonly used plot. It displays the median, first and third quartile values and possible outliers of a continuous numerical variable. In this video I show you how to construct a box plot, how to change the colors and

From playlist Data viz using Plotly for Python

Video thumbnail

Chapter07_Plotly_vignette

Introducing plotly, the online, collaborative plotting library.

From playlist Learning medical statistics with python and Jupyter notebooks

Video thumbnail

Introduction to Dash Plotly - Data Visualization in Python

An introduction to the Dash web application framework. Dash is used to create browser-based interactive data visualization interfaces with Python. My goal is for you to understand how to use Dash. 👉 A newer version of this video can be found here - https://youtu.be/7m0Bq1EGPPg The Code: h

From playlist Introduction to Dash Plotly

Video thumbnail

Kaggle Project From Scratch - Part 2 (Exploratory Data Analysis)

Follow along here: https://www.kaggle.com/kenjee/kaggle-project-from-scratch ! This is Part 2 of my kaggle project from scratch series where I analyze the kaggle data science developer survey data. In this video I show you how I approach data cleaning, data manipulation, and some light E

From playlist Data Science Projects

Video thumbnail

Easy coding to Visualize Geospatial Data in Python | NEW Tutorial in COLAB

GEO visualization in Python: Watch in real time Python code for interactive GEO Data Animation on a free COLAB notebook (openstreetmap, mapbox, ARCGIS, ..). GEO Data Animation of your Pandas df data or your csv data (of time series) w/ free and open-source Plotly Express. All credits to

From playlist Interactive Data Visualization in Python /Jupyter /Colab (2d, 3d, Animations, ..)

Video thumbnail

Explore Your Data and Then Let Others Do It Too Plotly Express and Dash

You start the morning exploring some data in a Jupyter notebook with Plotly Express and after lunch you whip up a web application to give your non-programmer colleagues access to those same insights with Dash, all in under a 100 lines of Python, no Javascript required. This talk will show

From playlist Data Visualizations

Video thumbnail

Intro to Plotly Dash - Chelsea Douglas

Subscribe to O'Reilly on YouTube: http://goo.gl/n3QSYi Follow O'Reilly on: Twitter: http://twitter.com/oreillymedia Facebook: http://facebook.com/OReilly Instagram: https://www.instagram.com/oreillymedia LinkedIn: https://www.linkedin.com/company-beta/8459/

From playlist The O’Reilly Jupyter Pop-up

Video thumbnail

Plotly Tutorial 2021

New Data Science / Machine Learning Video Everyday at 1 PM EST!!! [ Click Notification Bell ] This video provides complete coverage of Plotly with many real world examples. Plotly allows you to make beautiful static as well as animated charts! If you want a video that condenses the whol

From playlist Data Visualization for Data Science

Video thumbnail

How To Code Awesome Python: Vibrant 3D Data Visualizations in free COLAB NB

Real time Python: Interactive 3D Data (from Pandas df) visualization on your free COLAB notebook. 3D interactive visualization of your Pandas df data or your CSV data w/ free and open-source Plotly Express. All credits to Plotly.com. Next: ANIMATIONS (interactive) with data from Pandas d

From playlist Interactive Data Visualization in Python /Jupyter /Colab (2d, 3d, Animations, ..)

Video thumbnail

How to Code spectacular 3D Clusters w/ Pandas DataFrames in Python - Interactive Animation

How-to Code: Watch Python code unfold multiple Data (Pandas Dataframe) Cluster Dynamics in 3D Animation (in real time) on a free COLAB Jupyter Notebook. #3d #datascience #datavisualization

From playlist Interactive Data Visualization in Python /Jupyter /Colab (2d, 3d, Animations, ..)

Video thumbnail

How to Make Pie Charts in R

Pie charts are common data visualization to show categories in data as proportions of a whole. Pie charts are often maligned in the data visualization community, since the same data displayed by a pie chart can almost always be better represented using a bar chart or similar visualization

From playlist Code Clips: R Plots

Video thumbnail

JupyterLab and Plotly: A data visualization power couple- Lindsay Richman (McKinsey & Co.)

JupyterLab and Plotly work extremely well together, allowing users to quickly and efficiently create interactive charts using an array of programming languages and sources. With JupyterLab’s efficient interface, a multitude of files and notebook kernels may be displayed within a single bro

From playlist JupyterCon in New York 2018

Related pages

Julia (programming language) | MATLAB | Matplotlib | SciPy | Ggplot2 | R (programming language) | Embarrassingly parallel | Kubernetes | IGOR Pro