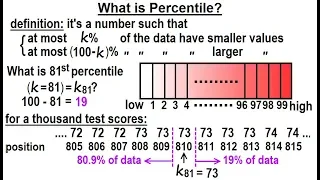
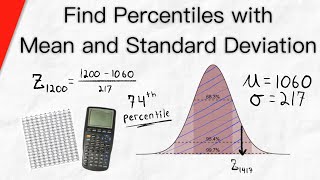
In statistics, the percentile rank (PR) of a given score is the percentage of scores in its frequency distribution that are less than that score. Its mathematical formula is where CF—the cumulative frequency—is the count of all scores less than or equal to the score of interest, F is the frequency for the score of interest, and N is the number of scores in the distribution. Alternatively, if CF' is the count of all scores less than the score of interest, then The figure illustrates the percentile rank computation and shows how the 0.5 × F term in the formula ensures that the percentile rank reflects a percentage of scores less than the specified score. For example, for the 10 scores shown in the figure, 60% of them are below a score of 4 (five less than 4 and half of the two equal to 4) and 95% are below 7 (nine less than 7 and half of the one equal to 7). Occasionally the percentile rank of a score is mistakenly defined as the percentage of scores lower than or equal to it, but that would require a different computation, one with the 0.5 × F term deleted. Typically percentile ranks are only computed for scores in the distribution but, as the figure illustrates, percentile ranks can also be computed for scores whose frequency is zero. For example, 90% of the scores are less than 6 (nine less than 6, none equal 6). In educational measurement, a range of percentile ranks, often appearing on a score report, shows the range within which the test taker's "true" percentile rank probably occurs. The "true" value refers to the rank the test taker would obtain if there were no random errors involved in the testing process. Percentile ranks are commonly used to clarify the interpretation of scores on standardized tests. For the test theory, the percentile rank of a raw score is interpreted as the percentage of examinees in the norm group who scored below the score of interest. Percentile ranks are not on an equal-interval scale; that is, the difference between any two scores is not the same as between any other two scores whose difference in percentile ranks is the same. For example, 50 − 25 = 25 is not the same distance as 60 − 35 = 25 because of the bell-curve shape of the distribution. Some percentile ranks are closer to some than others. Percentile rank 30 is closer on the bell curve to 40 than it is to 20. If the distribution is normally distributed, the percentile rank can be inferred from the standard score. (Wikipedia).
Percentiles, Deciles, Quartiles
Understanding percentiles, quartiles, and deciles through definitions and examples
From playlist Unit 1: Descriptive Statistics
Statistics: Ch 2 Graphical Representation of Data (46 of 62) What is Percentile?
Visit http://ilectureonline.com for more math and science lectures! We will learn what is a percentile. To donate: http://www.ilectureonline.com/donate https://www.patreon.com/user?u=3236071 . Next video in this series can be seen at: https://youtu.be/ImeJFYlaGdw
From playlist STATISTICS CH 2 GRAPHICAL REPRESENTATION OF DATA
This video defines and provides example of percentiles. The lesson relates quartiles to percentiles http://mathispower4u.com
From playlist Statistics: Describing Data
How to use the PERCENTILE and PERCENTRANK functions in Excel 2013
Visit us at http://www.statisticshowto.com for more videos and articles for elementary statistics
From playlist Excel for Statistics
Find Percentile with Mean and Standard Deviation (Normal Curves) | Statistics
We go over how to find percentiles with mean and standard deviation for a normal distribution, using a calculator (similar to TI-83) and a standard normal table. We discuss two problems, one where we are given a value and asked to calculate its percentile, and another where we are given a
From playlist Statistics
Find a Percentile of a Given Data Set (Average Method)
This video explains how to determine a percentile for a given data set. http://mathispower4u.com
From playlist Statistics: Describing Data
Excel 2010 Preview #3: New Percentile Function PERCENTILE.EXC
Download Excel file: https://people.highline.edu/mgirvin/YouTubeExcelIsFun/Excel2010NewAwesomeThings1-8.xlsx Amazing new Percentile function that blows the old one away! See the new Excel 2010 PERCENTILE.EXC function that will calculate a percentile with (n + 1)*%.Also see PERCENTILE.INC
From playlist Excel 2010 Videos
How to find the 20th and 80th percentile of a data set
👉 Learn how to find the percentile of a data set. The kth percentile of a data set is the data value that appeared in the kth position after the dataset has been divided into 100 equal parts. Thus to find the kth percentile of a dataset, we first divide the dataset into 100 equal parts, an
From playlist Statistics
Excel 2013 Statistical Analysis #19: Location: Percentile, Quartile, Rank and Percentile Rank
Download file: https://people.highline.edu/mgirvin/AllClasses/210Excel2013/Ch03/Excel2013StatisticsChapter03.xlsm Topics in this video: 1. (00:24) Percentile where position is calculated with P%*(n+1) 2. (04:26) PERCENTILE.EXC function 3. (05:18) What percentile tells you 4. (06:09) QUARTI
From playlist Excel for Statistical Analysis in Business & Economics Free Course at YouTube (75 Videos)
Excel 2010 Statistics #27: Excel 2010 Functions for Percentile, Quartile and Rank
Download Excel File #1: https://people.highline.edu/mgirvin/AllClasses/210Excel2010/Content/Ch03/Excel2010StatisticsCh03correct.xlsm Download Excel File #2: https://people.highline.edu/mgirvin/AllClasses/210Excel2010/Content/Ch03/Excel2010StatisticsCh03SecondFile.xlsm Download Excel File #
From playlist Excel 2010 Videos
Excel Statistical Analysis 12: Percentile, Quartile, Percentile Rank and Rank Functions & Algorithms
Download Excel File: https://excelisfun.net/files/Ch03-ESA.xlsm Learn about calculating percentiles, quartiles, percentile rank and rank. Lean about two different algorithms for the percentile calculation. Learn about how to use eight different Excel built-in functions: ROWS, PERCENTILE.EX
From playlist Excel Statistical Analysis for Business Class Playlist of Videos from excelisfun
Excel 2010 Statistics #26: Location: Mean, Median, Mode, Percentile, Quartile, PercentileRank
Download Excel File #1: https://people.highline.edu/mgirvin/AllClasses/210Excel2010/Content/Ch03/Excel2010StatisticsCh03correct.xlsm Download Excel File #2: https://people.highline.edu/mgirvin/AllClasses/210Excel2010/Content/Ch03/Excel2010StatisticsCh03SecondFile.xlsm Download Excel File #
From playlist Excel 2010 Videos
Excel Statistics 38: Data Analysis Add-in Rank & Percentile
Download Excel Start File 1: https://people.highline.edu/mgirvin/AllClasses/210M/Content/ch03/Busn210ch03.xls Download Excel Finished File 1: https://people.highline.edu/mgirvin/AllClasses/210M/Content/ch03/Busn210ch03Finished.xls Download Excel Start File 2: https://people.highline.edu/mg
From playlist Excel Data Analysis Add-in Toolpak for Statistics
Excel Statistics 33: Measures Of Location
Download Excel Start File 1: https://people.highline.edu/mgirvin/AllClasses/210M/Content/ch03/Busn210ch03.xls Download Excel Finished File 1: https://people.highline.edu/mgirvin/AllClasses/210M/Content/ch03/Busn210ch03Finished.xls Download Excel Start File 2: https://people.highline.edu/mg
From playlist Excel 2007 Statistics: Charts, Functions, Formulas
Calculating percentile | Modeling data distributions | AP Statistics | Khan Academy
Learn how to calculate the percentile rank for a given data point. View more lessons or practice this subject at http://www.khanacademy.org/math/ap-statistics/density-curves-normal-distribution-ap/percentiles-cumulative-relative-frequency/v/calculating-percentile?utm_source=youtube&utm_me
From playlist Modeling data distributions | AP Statistics | Khan Academy
Excel Magic Trick 989: Conditional Formatting For Values above 90% Percentile Mark
Download Excel File: http://people.highline.edu/mgirvin/ExcelIsFun.htm 1. Use logical formula and PERCENTRANK.INC function to add conditional formatting to values that are above the 90% percentile mark. 2. See how to create formulas in cells first, and then copy and paste formula into Cond
From playlist Excel Conditional Formatting Tricks
Mr Excel & excelisfun Trick 23: Excel 2010 New Functions
Download Files: https://people.highline.edu/mgirvin/YouTubeExcelIsFun/MrExcelExcelisfunTrick23.xlsx See Mr Excel and excelisfun show off the new Excel 2010 functions: NETWORKINGDAYS.INT, RANK.AVE, PERCENTILE.EXC, CONFIDENCE.T, T.DIST, T.DIST.RT and T.DIST.2T.
From playlist Excel Series: Mr Excel & excelisfun Excel Tricks
Lecture with Per B. Brockhoff. Chapters: 00:00 - Percentiles; 03:30 - Example; 07:00 - Figures And Tables;
From playlist DTU: Introduction to Statistics | CosmoLearning.org