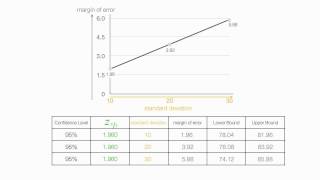
How to calculate margin of error and standard deviation
In this tutorial I show the relationship standard deviation and margin of error. I calculate margin of error and confidence intervals with different standard deviations. Playlist on Confidence Intervals http://www.youtube.com/course?list=EC36B51DB57E3A3E8E Like us on: http://www.facebook
From playlist Confidence Intervals

Statistics: Ch 7 Sample Variability (11 of 14) What is "The Standard Error of the Mean"?
Visit http://ilectureonline.com for more math and science lectures! To donate: http://www.ilectureonline.com/donate https://www.patreon.com/user?u=3236071 What is “the standard error of the mean”? It is the standard deviation (of the sampling distribution) of the sample means. Previous
From playlist STATISTICS CH 7 SAMPLE VARIABILILTY

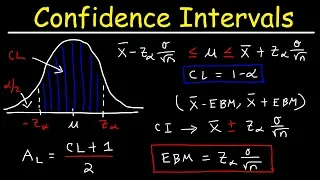
How To Find The Z Score, Confidence Interval, and Margin of Error for a Population Mean
This statistics video tutorial explains how to find the z-score that will be used to find the confidence interval and margin of error for a population mean. This video contains 2 example problems in which you're asked to find a 90% and 95% confidence interval given the population standard
From playlist Statistics

Lesson: Calculate a Confidence Interval for a Population Proportion
This lesson explains how to calculator a confidence interval for a population proportion.
From playlist Confidence Intervals

Brief overview of the standard error. What it represents and how you would find it with a formula.
From playlist Basic Statistics (Descriptive Statistics)
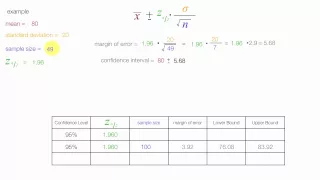
How to calculate sample size and margin of error
In this tutorial I show the relationship between sample size and margin of error. I calculate the margin of error and confidence interval using three different sample sizes. As the sample size increases the margin of error goes down. Like us on: http://www.facebook.com/PartyMoreStudyLes
From playlist Confidence Intervals

Case Studies with Data: Mitigating Gender Bias on the UCI Adult Dataset
MIT RES.EC-001 Exploring Fairness in Machine Learning, Spring 2020 Instructor: Audace Nakeshimana View the complete course: https://ocw.mit.edu/RES-EC-001S20 YouTube Playlist: https://www.youtube.com/playlist?list=PLUl4u3cNGP63IFQn8FklBOUhYVcmaxpOX This video explores principles involved
From playlist MIT RES.EC-001 Exploring Fairness in Machine Learning, Spring 2020

Statistics Lecture 3.4: Finding Z-Score, Percentiles and Quartiles, and Comparing Standard Deviation
https://www.patreon.com/ProfessorLeonard Statistics Lecture 3.4: Finding the Z-Score, Percentiles and Quartiles, and Comparing Standard Deviation
From playlist Statistics (Full Length Videos)

Speaker: Jim "Trixter" Leonard A candidate for Most Stupid PC Trick, 8088 Corruption displays full-motion color video on a stock IBM PC with nothing more than a CGA card and a Sound Blaster Pro for audio. It became a minor web phenomenon when a video of it in operation was posted to the s
From playlist Notacon 4

Preference Modeling with Context-Dependent Salient Features - Laura Balzano
Seminar on Theoretical Machine Learning Topic: Preference Modeling with Context-Dependent Salient Features Speaker: Laura Balzano Affiliation: University of Michigan; Member, School of Mathematics Date: February 27, 2020 For more video please visit http://video.ias.edu
From playlist Mathematics
Lecturer: Dr. Erin M. Buchanan Spring 2021 https://www.patreon.com/statisticsofdoom The last section of our course covers the beginnings of ANOVAs. You will learn about the analysis of variance, the logic of the hypothesis test, the F-test, summary tables, and how to calculate in R. We
From playlist Graduate Statistics Flipped
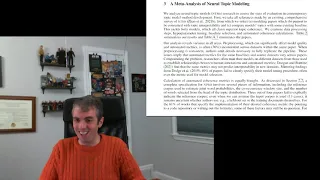
Is Automated Topic Model Evaluation Broken?: The Incoherence of Coherence [Paper Read Out Loud]
http://umiacs.umd.edu/~jbg//docs/2021_neurips_incoherence.pdf
From playlist Papers Read Aloud
Comparison of systematic and random error. Types of systematic error, including offset error and scale factor error/
From playlist Experimental Design
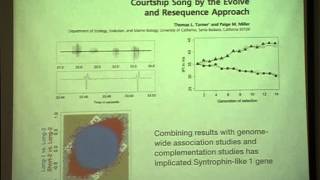
John Novembre - Addressing challenges from next generation sequencing
PROGRAM: School and Discussion Meeting on Population Genetics and Evolution PROGRAM LINK: http://www.icts.res.in/program/PGE2014 DATES: Saturday 15 Feb, 2014 - Monday 24 Feb, 2014 VENUE: Physics Auditorium, IISc, Bangalore Just as evolution is central to our understanding of biology, p
From playlist School and Discussion Meeting on Population Genetics and Evolution

Jamovi 1.2/1.6 Tutorial: Repeated Measures ANOVA (Episode 12)
In this Jamovi tutorial, I go through a full example from some canned data a one-way Repeated Measures ANOVA! Features include setting up labels and variables, post-hoc tests, marginal means, and getting additional stats like effect size. Jamovi stats: https://www.jamovi.org/ NOTE: This
From playlist Jamovi Tutorials

Predictive Modelling Techniques | Data Science With R Tutorial
🔥 Advanced Certificate Program In Data Science: https://www.simplilearn.com/pgp-data-science-certification-bootcamp-program?utm_campaign=PredictiveModeling-0gf5iLTbiQM&utm_medium=Descriptionff&utm_source=youtube 🔥 Data Science Bootcamp (US Only): https://www.simplilearn.com/data-science-bo
From playlist R Programming For Beginners [2022 Updated]

Foundations of ANOVA – Variance Between and Within (12-2)
When measuring groups with ANOVA, there are two sources of variance: between and within. Variance between groups is due to actual treatment effect plus differences due to chance (or error). True variance between indicates differences between groups. Variance within the groups is due only t
From playlist WK12 One-Way ANOVA - Online Statistics for the Flipped Classroom
Six Sigma Full Course | Six Sigma Explained | Six Sigma Green Belt Training | Simplilearn
🔥Green Belt Certification Training Course: https://www.simplilearn.com/quality-management/lean-six-sigma-green-belt-training?utm_campaign=SixSigma-KfFez57ay6E&utm_medium=Descriptionff&utm_source=youtube 🔥Post Graduate Program In Lean Six Sigma: https://www.simplilearn.com/pgp-lean-six-sigm
From playlist Simplilearn Free Courses [2022 Updated]

Rate Problems (1 of 3: Overall tips)
More resources available at www.misterwootube.com
From playlist Working with Rates and Ratios