Functions related to probability distributions
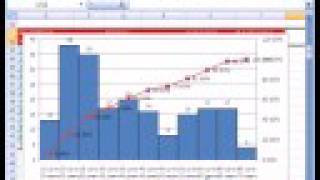
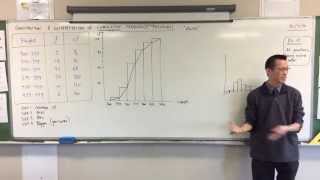
In statistics, an ogive, also known as a cumulative frequency polygon, can refer to one of two things: * any hand drawn graphic of a cumulative distribution function * any empirical cumulative distribution function. The points plotted as part of an ogive are the upper class limit and the corresponding cumulative absolute frequency or cumulative relative frequency. The ogive for the normal distribution resembles one side of an Arabesque or ogival arch, which is likely the origin of its name. (Wikipedia).
Statistics: Ch 2 Graphical Representation of Data (15 of 62) Ogive: A Closer Look
Visit http://ilectureonline.com for more math and science lectures! We will learn and graph the 2 methods that we can graph an ogive graph. We can graph it against cumulative (entire data) frequency or cumulative relative (%) frequency. To donate: http://www.ilectureonline.com/donate htt
From playlist STATISTICS CH 2 GRAPHICAL REPRESENTATION OF DATA
Understanding ogives (cumulative frequency graphs) and calculating medians and quartiles and IQRs from them
From playlist Unit 1: Descriptive Statistics
This video explains how to determine mean, median and mode. It also provided examples. http://mathispower4u.yolasite.com/
From playlist Statistics: Describing Data
Determining Skewness In Ogive Graphs
I help you identify left skewness, right skewness, and bell curves in an Ogive graph. At 6:40 I said "this is left skewed"- that is incorrect. Skewness is determined by the direction of the tail. In the histogram, the tail tapers off to the right, so it is right skewed. Check out http://w
From playlist AP Statistics
Excel Statistics 22: Histogram & Ogive Charts & % Cumulative Frequency
Download Excel Files: Start File: https://people.highline.edu/mgirvin/AllClasses/210M/Content/ch02/Busn210ch02.xls Finished File: https://people.highline.edu/mgirvin/AllClasses/210M/Content/ch02/Busn210ch02Finished.xls Full Page With All File Links: http://people.highline.edu/mgirvin/e
From playlist Excel Statistics Business 02: Descriptive Statistics
Excel 2010 Statistics #17 Ogive Chart Formula PivotTable Data Analysis Toolpak Add-in & Pareto Chart
Download Excel File: https://people.highline.edu/mgirvin/AllClasses/210Excel2010/Content/Ch02/Busn210Excel2010Chapter02.xlsm 1. Ogive Chart and Cumulative Frequencies -- Formulas (1:40 min) 2. Ogive Chart and Cumulative Frequencies -- PivotTable Pivot Table(21:00 min) 3. Pareto Chart (Sor
From playlist Excel 2010 Videos
Distribution Shapes, Ogive Graphs, and Time Plots
A review of the shapes of distributions and the relationships between the three measures of center. Also included is an intro to the Ogive graph and Time Plots. Check out http://www.ProfRobBob.com, there you will find my lessons organized by class/subject and then by topics within each c
From playlist AP Statistics
Statistics: Ch 2 Graphical Representation of Data (13 of 62) Ogive
Visit http://ilectureonline.com for more math and science lectures! We will learn what is and how data is represented in a ogive graph. In this example, 25 number grades in a class. Ogive provide the cumulative relative frequency. To donate: http://www.ilectureonline.com/donate https://w
From playlist STATISTICS CH 2 GRAPHICAL REPRESENTATION OF DATA
Statistical Analysis Exam Review (3 of 6: Ogive, inferences from mean)
More resources available at www.misterwootube.com
From playlist Descriptive Statistics & Bivariate Data Analysis
I recently uploaded 200 videos that are much more concise with excellent graphics. Click the link in the upper right-hand corner of this video. It will take you to my youtube channel where videos are arranged in playlists. In this older video: Displaying univariate data with graphs
From playlist Older Statistics Videos and Other Math Videos
Populations, Samples, Parameters, and Statistics
Please Subscribe here, thank you!!! https://goo.gl/JQ8Nys Populations, Samples, Parameters, and Statistics
From playlist Statistics
Percentiles, Deciles, Quartiles
Understanding percentiles, quartiles, and deciles through definitions and examples
From playlist Unit 1: Descriptive Statistics
This lesson introduces some of the common vocabulary when studying statistics. Site: http://mathispower4u.com
From playlist Introduction to Statistics
Excel Statistics 31: Histogram using Data Analysis Add-in
Download Excel Files: Start File: https://people.highline.edu/mgirvin/AllClasses/210M/Content/ch02/Busn210ch02.xls Finished File: https://people.highline.edu/mgirvin/AllClasses/210M/Content/ch02/Busn210ch02Finished.xls Full Page With All File Links: http://people.highline.edu/mgirvin/exce
From playlist Excel Statistics Business 02: Descriptive Statistics
Excel Statistical Analysis 01: Data & Statistics
Download Excel File: https://excelisfun.net/files/Ch01-ESA.xlsm Topics in video: (00:00) Introduction (00:54) Use File Explorer, Show File Extensions, Create Folder for class (02:59) Use People Web Site to download files for this class (05:58) How to open Excel files using File Explorer (0
From playlist Excel Statistical Analysis for Business Class Playlist of Videos from excelisfun