
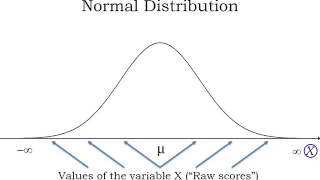
The Normal Distribution (1 of 3: Introductory definition)
More resources available at www.misterwootube.com
From playlist The Normal Distribution

Statistics Lecture 6.3: The Standard Normal Distribution. Using z-score, Standard Score
https://www.patreon.com/ProfessorLeonard Statistics Lecture 6.3: Applications of the Standard Normal Distribution. Using z-score, Standard Score
From playlist Statistics (Full Length Videos)
Standard Normal Distribution: Relate Standard Deviation to Z-scores
This video relates standard deviations to z-scores. http://mathispower4u.com
From playlist The Normal Distribution
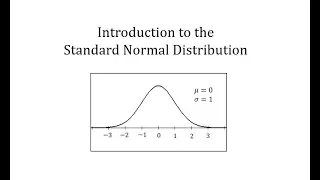
Introduction to the Standard Normal Distribution
This video introduces the standard normal distribution http://mathispower4u.com
From playlist The Normal Distribution

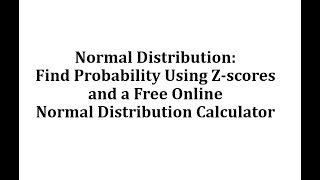
Normal Distribution: Find Probability Given Z-scores Using a Free Online Calculator
This video explains how to determine normal distribution probabilities given z-scores using a free online calculator. http://dlippman.imathas.com/graphcalc/graphcalc.html
From playlist The Normal Distribution
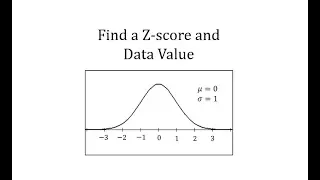
Normal Distribution: Find a Z Score and a Data Value (General)
This video explains how to determine a z-score and how to use a z-score to determine a data value. http://mathispower4u.com
From playlist The Normal Distribution
Normal Distribution: Find Probability Given Z-scores Using a Free Online Calculator (MOER/MathAS)
This video explains how to determine normal distribution probabilities given z-scores using a free online calculator. https://oervm.s3-us-west-2.amazonaws.com/stats/probs.html
From playlist The Normal Distribution

This lesson explains how to determine a z-score and how to find a z-score for a given data value. The percent of data above and below a data value and z-score is also found. Site: http://mathispower4u.com
From playlist The Normal Distribution

Normal Distribution: Use the Empirical Rule to Find Percent of Scores Less Than Or Equal to X
This video explains how to apply empirical rule to determine percent of scores less than or equal to a given exam score. http://mathispower4u.com
From playlist The Normal Distribution

The Normal Probability Distribution in Business Statistics (Week 10B)
The normal distribution is the most important distribution in all of statistics. We learn about the characteristics fo the curve and how to create z-scores in a standard normal curve. To find probabilities under the curve, this example uses Normal_Distribution_z_MultiTool_RbD.xlsx (link be
From playlist Basic Business Statistics (QBA 237 - Missouri State University)

Recorded: Spring 2015 Lecturer: Dr. Erin M. Buchanan This video covers the basic concepts behind z-scores, how to calculate them, and find percentages under the curve. Note: This video has an unfortunate amount of background noise and will be replaced sometime in the future. Lecture ma
From playlist PSY 200 (SPSS) Undergraduate Statistics with Dr. B

Challenging Normal Dist Problems
standardized scores and determining mean and std dev from percentiles of scores
From playlist Unit 2: Normal Distributions

Statistics Lecture 6.2 Part 5: Introduction to the Normal Distribution
From playlist Statistics Playlist 1
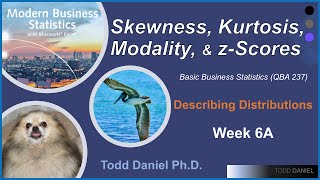
Describing Distributions with Skewness, Kurtosis, Modality, & z-Scores Business Statistics (Week 6A)
The normal curve is the most important distribution in statistics. When distributions differ from normality, we describe them with kurtosis (leptokurtic, platykurtic, mesokurtic), with skewness (positive or negative), and with modality (unimodal, bimodal, multimodal). In addition to those
From playlist Basic Business Statistics (QBA 237 - Missouri State University)

Z-scores, Standard Normal Distribution and Percentages/Area on the TI-84 Lesson
This video provides a lesson on z-scores, the Standard Normal distribution and finding percentages/area on the TI-84. http://mathispower4u.com
From playlist The Normal Distribution
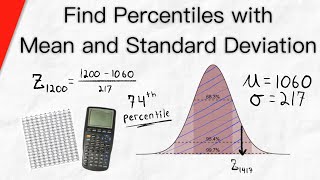
Find Percentile with Mean and Standard Deviation (Normal Curves) | Statistics
We go over how to find percentiles with mean and standard deviation for a normal distribution, using a calculator (similar to TI-83) and a standard normal table. We discuss two problems, one where we are given a value and asked to calculate its percentile, and another where we are given a
From playlist Statistics

Standard Normal Distribution of Z Scores
Z-scores called standardized scores are normally distributed
From playlist Unit 2: Normal Distributions

Statistics: Ch 6 The Normal Probability Distribution (14 of 28) How to use the Standard Score Part 2
Visit http://ilectureonline.com for more math and science lectures! To donate: http://www.ilectureonline.com/donate https://www.patreon.com/user?u=3236071 We will learn how to use the standard score, kind of in reverse. We will find what score, x=?, is required for you to be in the top 5
From playlist THE "HOW TO" PLAYLIST
Continuous uniform distribution and the standard normal distribution "Z"
Continuous uniform distribution and the standard normal distribution "Z"
From playlist Exam 2 material