
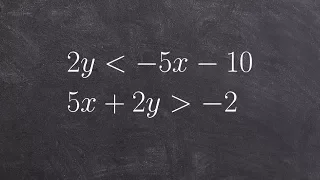
How to determine the solution of a system of linear inequalities by graphing
👉 Learn how to graph a system of inequalities. A system of inequalities is a set of inequalities which are collectively satisfied by a certain range of values for the variables. To graph a system of inequalities, each inequality making up the system is graphed individually with the side of
From playlist Solve a System of inequalities by Graphing | Standard Form

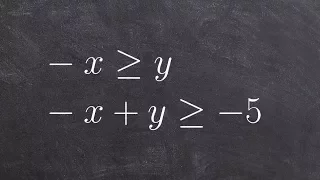
Graphing a linear system of linear inequalities
👉 Learn how to graph a system of inequalities. A system of inequalities is a set of inequalities which are collectively satisfied by a certain range of values for the variables. To graph a system of inequalities, each inequality making up the system is graphed individually with the side of
From playlist Solve a System of inequalities by Graphing | Standard Form
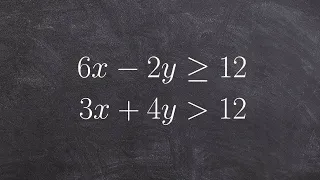
How to graph the system of linear inequalities using slope intercept form
👉 Learn how to graph a system of inequalities. A system of inequalities is a set of inequalities which are collectively satisfied by a certain range of values for the variables. To graph a system of inequalities, each inequality making up the system is graphed individually with the side of
From playlist Solve a System of inequalities by Graphing | Standard Form

Graphing the system of two linear inequalities with two horizontal line
👉 Learn how to graph a system of inequalities. A system of inequalities is a set of inequalities which are collectively satisfied by a certain range of values for the variables. To graph a system of inequalities, each inequality making up the system is graphed individually with the side of
From playlist Solve a System of Inequalities by Graphing

A Converse to a Theorem of Gross-Zaqier-Kolyvagin - Christopher Skinner
Christopher Skinner Princeton University; Member, School of Mathematics April 4, 2013 The theorem of the title is that if the L-function L(E,s) of an elliptic curve E over the rationals vanishes to order r=0 or 1 at s=1 then the rank of the group of rational rational points of E equals r a
From playlist Mathematics

What are the x and y intercepts of a linear equation
👉 Learn about graphing linear equations. A linear equation is an equation whose highest exponent on its variable(s) is 1. i.e. linear equations has no exponents on their variables. The graph of a linear equation is a straight line. To graph a linear equation, we identify two values (x-valu
From playlist ⚡️Graph Linear Equations | Learn About

Covariance (1 of 17) What is Covariance? in Relation to Variance and Correlation
Visit http://ilectureonline.com for more math and science lectures! To donate:a http://www.ilectureonline.com/donate https://www.patreon.com/user?u=3236071 We will learn the difference between the variance and the covariance. A variance (s^2) is a measure of how spread out the numbers of
From playlist COVARIANCE AND VARIANCE

What do I need to know to graph an equation in standard form
👉 Learn about graphing linear equations. A linear equation is an equation whose highest exponent on its variable(s) is 1. i.e. linear equations has no exponents on their variables. The graph of a linear equation is a straight line. To graph a linear equation, we identify two values (x-valu
From playlist ⚡️Graph Linear Equations | Learn About

Summary for graph an equation in Standard form
👉 Learn about graphing linear equations. A linear equation is an equation whose highest exponent on its variable(s) is 1. i.e. linear equations has no exponents on their variables. The graph of a linear equation is a straight line. To graph a linear equation, we identify two values (x-valu
From playlist ⚡️Graph Linear Equations | Learn About
Learn how to graph a system of two linear inequalities when the slope is 1
👉 Learn how to graph a system of inequalities. A system of inequalities is a set of inequalities which are collectively satisfied by a certain range of values for the variables. To graph a system of inequalities, each inequality making up the system is graphed individually with the side of
From playlist Solve a System of inequalities by Graphing | Standard Form
Learn how to graph and shade a system of linear inequalities in two different ways
👉 Learn how to graph a system of inequalities. A system of inequalities is a set of inequalities which are collectively satisfied by a certain range of values for the variables. To graph a system of inequalities, each inequality making up the system is graphed individually with the side of
From playlist Solve a System of inequalities by Graphing | Standard Form

The equation of state from neutron star post-merger remnants by Paul Lasky
PROGRAM VIRTUAL MEETING ON COMPACT STARS AND QCD 2020 (ORIGINALLY "COMPACT STARS IN THE QCD PHASE DIAGRAM VIII: THE ERA OF MULTI-MESSENGER ASTRONOMY") ORGANIZERS: Manjari Bagchi, Sarmistha Banik, Sudip Bhattacharyya, Prashanth Jaikumar, V. Ravindran and Sayantan Sharma DATE: 17 August