
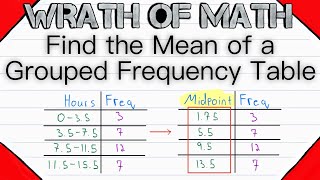
Mean of Grouped Frequency Tables
"Calculate mean from grouped frequency tables."
From playlist Data Handling: Frequency Tables
Find the Mean of Grouped Data | Statistics, Grouped Frequency Tables
How do we find the mean of grouped data? If we are given a grouped frequency table to represent data, that presents a challenge because we do not know the raw data values - we only know how many fall into certain groups. Thus, we are unable to calculate the mean the normal way. We'll go ov
From playlist Statistics
Grouped Data (1 of 2: Using Data groups to determine the frequency of dispersed data)
More resources available at www.misterwootube.com
From playlist Data Analysis

Grouped frequency tables (continuous)
Powered by https://www.numerise.com/ Grouped frequency tables (continuous)
From playlist Collecting data

Grouped Quantitative Discrete Data
From playlist d. Descriptive Statistics

More resources available at www.misterwootube.com
From playlist Data Analysis
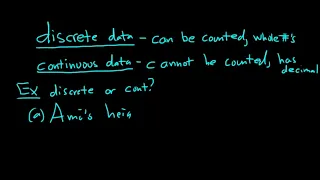
Discrete Data and Continuous Data
Please Subscribe here, thank you!!! https://goo.gl/JQ8Nys Discrete Data and Continuous Data
From playlist Statistics

Standard Deviation of Grouped Data
This statistics video tutorial explains how to calculate the standard deviation of grouped data. It discusses how to calculate the mean and the standard deviation given a frequency distribution table. My E-Book: https://amzn.to/3B9c08z Video Playlists: https://www.video-tutor.net Homew
From playlist Statistics

Array Variables - Introduction
This video introduces array variables. It defines an array variable as a named group of contiguous memory locations, each element of which can be accessed by means of an index number. It explains the difference between one dimensional and two dimensional arrays, and covers how these can
From playlist Data Structures

NUMBERS Can Do Three Jobs – Levels of Measurement NOIR (1-4)
We have been using numbers all of our lives. One of the first things that you learn as a young child is numbers. Maybe you had some blocks that taught you the names of the numbers. If you had siblings, you knew whether you were firstborn, or second, or third. Before long, you were learning
From playlist From Numbers to Variables to Data in Statistics (WK 1 - QBA 237)

Building Rich, High Performance Tools for Practical Data Analysis
Recorded from a Live Webcast This talk is presented by Wes McKinney author of Python for Data Analysis and will be a somewhat advanced, technical talk connecting computer science concepts like data structure design and algorithms with the details of building intuitive, high performance, a
From playlist O'Reilly Webcasts 2
V-2 Clustering with Kmeans: Normalize our data, Does it improve it? | Python | Unsupervised learning
Are you ready to learn about Kmeans? Does normalization of our data improves k-means performance? #python #k-means #kmeans In this super chapter, we'll cover the discovery of clusters or groups through the partitioning algorithm K-means with python and the JUPYTER NOTEBOOK. Pandas librar
From playlist Python

Patrizio Frosini (8/30/21): On the role of group equivariant non-expansive operators in TDA
Group equivariant non-expansive operators (GENEOs) have been recently introduced as mathematical tools for approximating data observers, when data are represented by real-valued or vector-valued functions. The use of these operators is based on the assumption that the interpretation of dat
From playlist Beyond TDA - Persistent functions and its applications in data sciences, 2021

Groupby Function (Pandas Tutorials 08)
Join this channel to get access to perks: https://www.youtube.com/channel/UC5vr5PwcXiKX_-6NTteAlXw/join If you enjoy this video, please subscribe. ✅Be my Patron: https://www.patreon.com/WJBMattingly ✅PayPal: https://www.paypal.com/cgi-bin/webscr?cmd=_donations&business=AZ73QW52SUX8N&curr
From playlist Pandas Python Tutorials

More info: https://community.ai.science/earth-environmental-data-science-workshop
From playlist NRCan Environmental Data Science Outreach

Guy Rothblum and Omer Reingold - A Multi-Group Approach to Algorithmic Fairness - IPAM at UCLA
Recorded 19 July 2022. Guy Rothblum of Apple Inc. and Omer Reingold of Stanford University present "A Multi-Group Approach to Algorithmic Fairness" at IPAM's Who Counts? Sex and Gender Bias in Data workshop. Learn more online at: http://www.ipam.ucla.edu/programs/workshops/who-counts-sex-a
From playlist 2022 Who Counts? Sex and Gender Bias in Data

Python pandas — Grouping Exercises — Regiment
Sometimes we learn best by doing. Unlike my other videos, I’ll be going through these exercises cold. Sometimes we’ll encounter ambiguous questions, and sometimes I'll be wrong. Learning from our mistakes can be a powerful teacher. So, it’s OK to be wrong now, because we’ll know how to avo
From playlist Python pandas -- Learning by doing

Data Graphs: Create Grouped Frequency Table From Decimals (Grade 2) - OnMaths GCSE Maths Revision
Topic: Data Graphs: Create Grouped Frequency Table From Decimals Do this paper online: https://www.onmaths.com/data-graphs-2/ Grade: 2 This question appears on calculator and non-calculator foundation GCSE papers. Practise and revise with OnMaths. Go to onmaths.com for more resources, lik
From playlist Data Graphs

Python Pandas Tutorial (Part 8): Grouping and Aggregating - Analyzing and Exploring Your Data
In this video, we will be learning how to group and aggregate our data. This video is sponsored by Brilliant. Go to https://brilliant.org/cms to sign up for free. Be one of the first 200 people to sign up with this link and get 20% off your premium subscription. In this Python Programmin
From playlist Pandas Tutorials