
Covariance (11 of 17) Covariance Matrix with 3 Data Sets (Part 2)
Visit http://ilectureonline.com for more math and science lectures! To donate:a http://www.ilectureonline.com/donate https://www.patreon.com/user?u=3236071 We will find the covariance matrix of 3 data sets. Part 2 Next video in this series can be seen at: https://youtu.be/O5v8ID5Cz_8
From playlist COVARIANCE AND VARIANCE

Covariance (1 of 17) What is Covariance? in Relation to Variance and Correlation
Visit http://ilectureonline.com for more math and science lectures! To donate:a http://www.ilectureonline.com/donate https://www.patreon.com/user?u=3236071 We will learn the difference between the variance and the covariance. A variance (s^2) is a measure of how spread out the numbers of
From playlist COVARIANCE AND VARIANCE

Covariance Definition and Example
What is covariance? How do I find it? Step by step example of a solved covariance problem for a sample, along with an explanation of what the results mean and how it compares to correlation. 00:00 Overview 03:01 Positive, Negative, Zero Correlation 03:19 Covariance for a Sample Example
From playlist Correlation
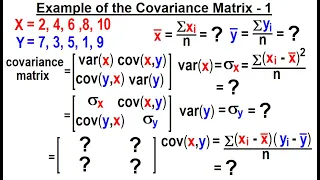
Covariance (6 of 17) Example of the Covariance Matrix - EX 1
Visit http://ilectureonline.com for more math and science lectures! To donate:a http://www.ilectureonline.com/donate https://www.patreon.com/user?u=3236071 We will find the covariance matrix of 2 data sets. Example 1 Next video in this series can be seen at: https://youtu.be/9DscP6F5CGs
From playlist COVARIANCE AND VARIANCE

Covariance (14 of 17) Covariance Matrix "Normalized" - Correlation Coefficient
Visit http://ilectureonline.com for more math and science lectures! To donate:a http://www.ilectureonline.com/donate https://www.patreon.com/user?u=3236071 We will find the “normalized” matrix (or the correlation coefficients) from the covariance matrix from the previous video using 3 sa
From playlist COVARIANCE AND VARIANCE

Special Topics - The Kalman Filter (22 of 55) Finding the Covariance Matrix, Numerical Ex. 2
Visit http://ilectureonline.com for more math and science lectures! In this video I will calculate the numerical values of the covariance (non-diagonal) elements of a 3x3 covariance matrix. Next video in this series can be seen at: https://youtu.be/9B5vEVjH2Pk
From playlist SPECIAL TOPICS 1 - THE KALMAN FILTER

Covariance (8 of 17) What is the Correlation Coefficient?
Visit http://ilectureonline.com for more math and science lectures! To donate:a http://www.ilectureonline.com/donate https://www.patreon.com/user?u=3236071 We will learn what is and how to find the correlation coefficient of 2 data sets and see how it corresponds to the graph of the data
From playlist COVARIANCE AND VARIANCE
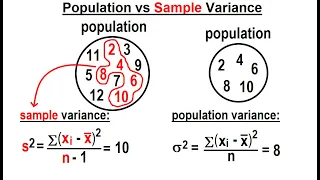
Covariance (3 of 17) Population vs Sample Variance
Visit http://ilectureonline.com for more math and science lectures! To donate:a http://www.ilectureonline.com/donate https://www.patreon.com/user?u=3236071 We will learn the difference and calculate the variance of a population and the variance of a sample of a population. Next video in
From playlist COVARIANCE AND VARIANCE

Covariance (12 of 17) Covariance Matrix wth 3 Data Sets and Correlation Coefficients
Visit http://ilectureonline.com for more math and science lectures! To donate:a http://www.ilectureonline.com/donate https://www.patreon.com/user?u=3236071 We will find the correlation coefficients of the 3 data sets form the previous 2 videos. Next video in this series can be seen at:
From playlist COVARIANCE AND VARIANCE

Iain Johnstone: Eigenvalues and variance components
Abstract: Motivated by questions from quantitative genetics, we consider high dimensional versions of some common variance component models. We focus on quadratic estimators of 'genetic covariance' and study the behavior of both the bulk of the estimated eigenvalues and the largest estimat
From playlist Probability and Statistics

Statistical Rethinking Fall 2017 - week09 lecture16
Week 09, lecture 16 for Statistical Rethinking: A Bayesian Course with Examples in R and Stan, taught at MPI-EVA in Fall 2017. This lecture covers Chapter 13. Slides are available here: https://speakerdeck.com/rmcelreath/statistical-rethinking-fall-2017-lecture-16 Additional informatio
From playlist Statistical Rethinking Fall 2017


A Random Matrix Bayesian framework for out-of-sample quadratic optimization - Marc Potters
Marc Potters CFM November 6, 2013 For more videos, please visit http://video.ias.edu
From playlist Mathematics

Statistical Rethinking Winter 2019 Lecture 17
Lecture 17 of the Dec 2018 through March 2019 edition of Statistical Rethinking: A Bayesian Course with R and Stan. Introduction to varying slopes and covariance priors.
From playlist Statistical Rethinking Winter 2019

TeraLasso for sparse time-varying image modeling - Hero - Workshop 2 - CEB T1 2019
Alfred Hero (Univ. of Michigan) / 15.03.2019 TeraLasso for sparse time-varying image modeling. We propose a new ultrasparse graphical model for representing time varying images, and other multiway data, based on a Kronecker sum representation of the spatio-temporal inverse covariance ma
From playlist 2019 - T1 - The Mathematics of Imaging

Special Topics - The Kalman Filter (7 of 55) The Multi-Dimension Model 1
Visit http://ilectureonline.com for more math and science lectures! In this video I will explain the overview of the Kalman filter on a multi dimension model. Next video in this series can be seen at: https://youtu.be/F7vQXNro7pE
From playlist SPECIAL TOPICS 1 - THE KALMAN FILTER
How to Use a Kalman Filter in Simulink | Understanding Kalman Filters, Part 6
Download our Kalman Filter Virtual Lab to practice linear and extended Kalman filter design of a pendulum system with interactive exercises and animations in MATLAB and Simulink: https://bit.ly/3g5AwyS This video demonstrates how you can estimate the angular position of a simple pendulum
From playlist Understanding Kalman Filters

Deep Learning Lecture 7.3 - TICA, TCCA and time-autoencoders
Learning Slow Manifolds with Markovian methods: - time-lagged canonical correlation analysis (TCCA) - time-lagged independent component analysis (TICA) - time-autoencoders
From playlist Deep Learning Lecture

Estimation of Coherence and Cross Spectra
http://AllSignalProcessing.com for more great signal-processing content: ad-free videos, concept/screenshot files, quizzes, MATLAB and data files. Averaging approaches for estimating coherence and cross spectra, analogous to Welch's averaged periodogram estimator of the power spectrum.
From playlist Estimation and Detection Theory

Nabil El Korso - Covariance & Subspace Inference: Handling Robustness, Variability and (...)
In this talk, we focus on covariance matrix inference and principal component analysis in the context of non-regular data under heterogeneous environments. First, we briefly introduce mixed effects models, which are widely used to analyze repeated measures data arising in several signal pr
From playlist 8th edition of the Statistics & Computer Science Day for Data Science in Paris-Saclay, 9 March 2023