
Scatter plots using Plotly for R
This videos show the creation of scatter plots using Plotly for the R programming language. The files are available online. R-markdown: https://github.com/juanklopper/Plotly-for-R RPubs: http://rpubs.com/juanhklopper/scatter_plots_using_plotly
From playlist Statistics
R programming for Beginners | R programming for data Science
R is a programming language and free software environment for statistical computing and graphics supported by the R Foundation for Statistical Computing. The R language is widely used among statisticians and data miners for developing statistical software and data analysis. This video is a
From playlist Programming
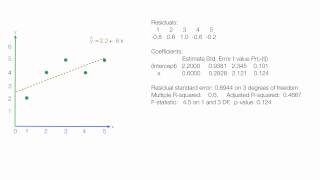
How to calculate Linear Regression using R. http://www.MyBookSucks.Com/R/Linear_Regression.R http://www.MyBookSucks.Com/R Playlist http://www.youtube.com/playlist?list=PLF596A4043DBEAE9C
From playlist Linear Regression.

1.6 Arrays and matrices in R | statistical analysis and data science course Rstudio | Dimensional
In this chapter of the video series in the crash course in statistics and data science with R / Rstudio we will see the definition, utilization, and importance of arrays with R. Also, we discuss their extension from vectors to matrices. Part 1: Definition - What is an array? - Array or
From playlist R Tutorial | Rstudio
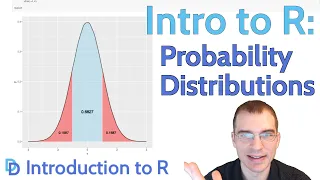
Introduction to R: Probability Distributions
Understanding the processes that generate the data we see is at the heart of data science. Much of the data we observe is generated by processes with an element of chance or randomness. Sometimes it rains, sometimes it doesn't. Probability is a statistical concept that describes the chance
From playlist Introduction to R

R Programming: Introduction: List data structure (R Intro-02)
[My R notebook file script is here https://github.com/bionicturtle/youtube/tree/master/r-intro] Unlike atomic vectors, list (vectors) are flexible: each element can be a different type (char, integer, numeric, logical or even a sub-list!). List[i] returns the i-th element as a list, while
From playlist R Programming: Intro

Introduction to R: Data Frames
Data Frames in R are data structures that store tabular data with rows and columns similar to an excel spreadsheet. Data Frames are among the most common data structures for working with data in R and many data reading functions load data into R in the form of data frames. They are analogo
From playlist Introduction to R

This tutorial cover the creation of bar charts using Plotly for R in RStudio. The HTML file can be viewed at http://rpubs.com/juanhklopper/bar_chart_plotly The RMD file is on Github at https://github.com/juanklopper/Plotly-for-R Bar charts show counts of the unique data point values i
From playlist Statistics
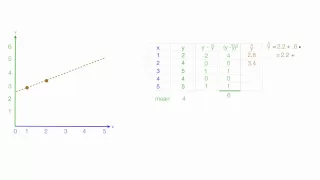
How to Calculate R Squared Using Regression Analysis
An example on how to calculate R squared typically used in linear regression analysis and least square method. Like us on: http://www.facebook.com/PartyMoreStudyLess Link to Playlist on Linear Regression: http://www.youtube.com/course?list=ECF596A4043DBEAE9C Link to Playlist on SPSS M
From playlist Linear Regression.

Introduction to Probability and Statistics 131A. Lecture 5. Expected Values
UCI Math 131A: Introduction to Probability and Statistics (Summer 2013) Lec 05. Introduction to Probability and Statistics: Expected Values View the complete course: http://ocw.uci.edu/courses/math_131a_introduction_to_probability_and_statistics.html Instructor: Michael C. Cranston, Ph.D.
From playlist Math 131A: Introduction to Probability and Statistics

Stochastic Resetting - CEB T2 2017 - Evans - 3/3
Martin Evans (Edinburgh) - 12/05/2017 Stochastic Resetting We consider resetting a stochastic process by returning to the initial condition with a fixed rate. Resetting is a simple way of generating a nonequilibrium stationary state in the sense that the process is held away from any eq
From playlist 2017 - T2 - Stochastic Dynamics out of Equilibrium - CEB Trimester

The BEST Way to Find a Random Point in a Circle | #SoME1 #3b1b
This is my first time ever making anything like this and it was a lot of fun! If you have any feedback for me, I'd be happy to hear it so I can improve for my next video. This video is also my entry into 3blue1brown's SoME competition. Animated with: The Manim Community Developers. (2021
From playlist Summer of Math Exposition Youtube Videos

Lec 8 | MIT 5.112 Principles of Chemical Science, Fall 2005
P Orbitals View the complete course: http://ocw.mit.edu/5-112F05 License: Creative Commons BY-NC-SA More information at http://ocw.mit.edu/terms More courses at http://ocw.mit.edu
From playlist MIT 5.112 Principles of Chemical Science, Fall 2005

Xincheng Zhang (U of Toronto) -- The Baik-Rains distribution and the KP equation
It has been discovered that the Kadomtsev-Petviashvili (KP) equation governs the distribution of the fluctuation of many random growth models. In particular, the Tracy-Widom distributions appear as special self-similar solutions of the KP equation. We prove that the anti-derivative of the
From playlist Northeastern Probability Seminar 2021

Dynamic formation of compact binaries (Course 4 - Lensing) Lecture - 04 by Sourav Chatterjee
Summer School on Gravitational-Wave Astronomy ORGANIZERS: Parameswaran Ajith, K. G. Arun and Bala R. Iyer DATE: 13 August 2018 to 24 August 2018 VENUE: Madhava Lecture Hall, ICTS, Bangalore This school is part of the annual ICTS summer schools on gravitational-wave (GW) astronomy. Rece
From playlist Summer School on Gravitational-Wave Astronomy - 2018

Generate uniform random distribution within a circle using Python 📚 🤔 🔢
In this micro tutorial, we explain how to generate uniformly distributed random numbers within a circle with radius R using Python. First, the algorithm and reopenings are given followed by simple Python implementation. The Python implementation using the random module to generate uniform
From playlist Engineering Animations

Learning models: connections between boosting...and regularity II - Russell Impagliazzo
Computer Science/Discrete Mathematics Seminar II Topic: Learning models: connections between boosting...regularity II Speaker: Russell Impagliazzo Affiliation: University of California, San Diego Date: November 14, 2017 For more videos, please visit http://video.ias.edu
From playlist Mathematics

Analyze Phase In Six Sigma | Six Sigma Green Belt Training
The fourth lesson of the Lean Six Sigma Green Belt Course offered by Simplilearn. This lesson will cover the details of the analyze phase. In the Lean Six Sigma process, you begin with the define phase where you define the problem and then the current process performance is measured. Next
From playlist Six Sigma Training Videos [2022 Updated]
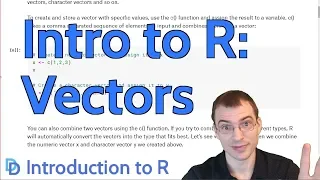
In this lesson we learn about the most basic compound data type in R: the vector. Vectors in R are essentially lists of values of the same basic data type. R vectors are great for data analytics and data science because many common functions are built to operate on entire vectors all at on
From playlist Introduction to R