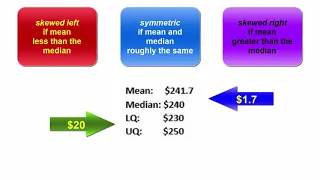
Mean v Median and the implications
Differences between the mean and median suggest the presence of outliers and/or the possible shape of a distribution
From playlist Unit 1: Descriptive Statistics

(PP 6.1) Multivariate Gaussian - definition
Introduction to the multivariate Gaussian (or multivariate Normal) distribution.
From playlist Probability Theory

Introduction to Bivariate Data (1 of 2: Dependent & independent variables)
More resources available at www.misterwootube.com
From playlist Descriptive Statistics & Bivariate Data Analysis

Introduction to R: Descriptive Statistics
Summarizing data with basic descriptive statistics is an important part of both data exploration and reporting. In this lesson we cover how to generate statistics that measure the center and spread of variables including the mean, median, mode, variance and standard deviation. ** Note: I
From playlist Introduction to R
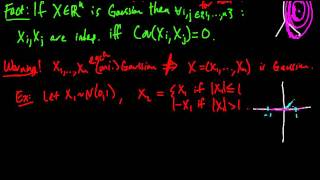
(PP 6.3) Gaussian coordinates does not imply (multivariate) Gaussian
An example illustrating the fact that a vector of Gaussian random variables is not necessarily (multivariate) Gaussian.
From playlist Probability Theory
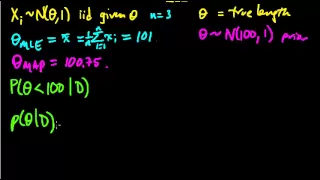
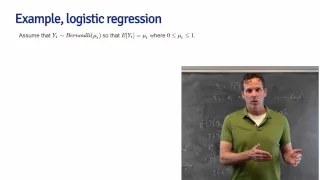
(ML 7.1) Bayesian inference - A simple example
Illustration of the main idea of Bayesian inference, in the simple case of a univariate Gaussian with a Gaussian prior on the mean (and known variances).
From playlist Machine Learning
Descriptive Statistics vs Inferential Statistics
This video tutorial provides an introduction into descriptive statistics and inferential statistics. My Website: https://www.video-tutor.net Patreon Donations: https://www.patreon.com/MathScienceTutor Amazon Store: https://www.amazon.com/shop/theorganicchemistrytutor Subscribe: https:
From playlist Statistics

More Standard Deviation and Variance
Further explanations and examples of standard deviation and variance
From playlist Unit 1: Descriptive Statistics

This lesson introduces some of the common vocabulary when studying statistics. Site: http://mathispower4u.com
From playlist Introduction to Statistics

Signal nonstationarities and their effects on the power spectrum
This video lesson is part of a complete course on neuroscience time series analyses. The full course includes - over 47 hours of video instruction - lots and lots of MATLAB exercises and problem sets - access to a dedicated Q&A forum. You can find out more here: https://www.udemy.
From playlist NEW ANTS #2) Static spectral analysis
Descriptive Statistics for Categorical Data - Statistics with SPSS 27 for Beginners (4 of 8)
Dr. Daniel, Diva, and Desi explain categorical variables and show you how to display them in tables, as numbers, and with graphs. You learn the correct choices for describing categorical data using the Dog Toys dataset and the FREQUENCIES menu in SPSS. We create frequency tables and bar c
From playlist Introduction to Statistics with IBM SPSS 27 for Beginners (with Puppies)

In this video David gives an introductory explanation of what the qauntum wavefunction is, how to use it, and where it comes from. Note: There is a missing square on Planck's constant in the left side of the Schrodinger equation written in the video. Sorry!
From playlist Quantum Physics | AP Physics 2 | Khan Academy

Statistics: Introduction (4 of 13) What is Statistics?
Visit http://ilectureonline.com for more math and science lectures! We will answer What is Statistics? It is the science of collecting classifying, presenting and interpreting data. There is also descriptive and inferential statistics. To donate: http://www.ilectureonline.com/donate http
From playlist THE "WHAT IS" PLAYLIST

Caterina Consani: The Arithmetic Site I
The lecture was held within the framework of the Hausdorff Trimester Program: Non-commutative Geometry and its Applications and the Workshop: Number theory and non-commutative geometry 25.11.2014
From playlist HIM Lectures: Trimester Program "Non-commutative Geometry and its Applications"

Axel Osmond - The over-topos at a model
Talk at the school and conference “Toposes online” (24-30 June 2021): https://aroundtoposes.com/toposesonline/ Slides: https://aroundtoposes.com/wp-content/uploads/2021/07/OsmondSlidesToposesOnline.pdf For a model of a geometric theory in a Grothendieck topos, we can construct the over-t
From playlist Toposes online

ZuriHac 2015 - Better Faster Binary Serialization
Google Tech Talk May 29, 2015 ("show more" for more information) Presented by Duncan Coutts https://wiki.haskell.org/ZuriHac2015#Duncan_Coutts ABSTRACT This talk is a case study in low level optimization in Haskell. We have existing libraries for binary serialization but the mainstream
From playlist ZuriHac 2015