
Long Term Debt to Equity Ratio, ROE, & Shareholder's Equity
This finance video tutorial explains how to calculate the long term debt to equity ratio (LT Debt/Eq) and the total debt to equity ratio (Debt/Eq) using a company's shareholder equity and the ROE or return on equity. My Website: https://www.video-tutor.net Patreon Donations: https://www
From playlist Stocks and Bonds

How To Calculate Your Average Cost Basis When Investing In Stocks
This video tutorial explains how to calculate the average cost basis or average cost per share when making multiple investment purchases of the same stock at different prices. Stock Trading Strategies For Beginners: https://www.youtube.com/watch?v=7IBzTZqeyo0 Call and Put Options: https:
From playlist Stocks and Bonds

10. Debt Markets: Term Structure
Financial Markets (ECON 252) The markets for debt, both public and private far exceed the entire stock market in value and importance. The U.S. Treasury issues debt of various maturities through auctions, which are open only to authorized buyers. Corporations issue debt with investment
From playlist Financial Markets (2008) with Robert Shiller
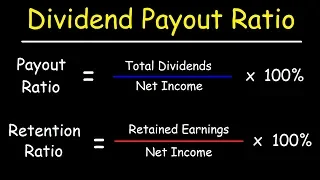
Dividends - Payout Ratio vs Retention Ratio
This stocks and bonds video tutorial explains how to calculate the dividend payout ratio and the retention ratio. The payout ratio is equal to the total dividends paid divided by the net income. The retention ratio is equal to the earnings retained divided by the net income. My Website:
From playlist Stocks and Bonds

What's a balance sheet? (6 min)
A snapshot of claims (right-hand side: liabilities + shareholders) on company assets (left-hand side: will convert to cash now or later). Three points: 1. equity is residual (equity = assets - liabilities), 2. Mixed model: historical cost is not fair value, and 3. We can use for ratio anal
From playlist Balance Sheet

Personal Finance - Assets, Liabilities, & Equity
This video explains what it means to have equity in your home. Equity is the difference between assets and liabilities. My Website: https://www.video-tutor.net Patreon Donations: https://www.patreon.com/MathScienceTutor Amazon Store: https://www.amazon.com/shop/theorganicchemistrytuto
From playlist Stocks and Bonds

This video explains the math behind investing in mutual funds. It discusses the value of a mutual fund's annual performance and the value of investing long term. A equity mutual fund is a financial vehicle that invests in a variety of stocks. Thus a mutual fund is a passive way for an i
From playlist Stocks and Bonds
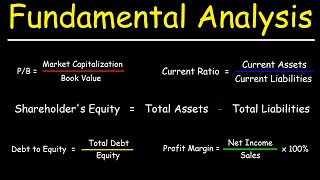
This video explains how to use fundamental analysis to determine if a company may be undervalued or overvalued by using valuation ratios such as the price to book ratio, price to sales, & price to earnings ratio. It also explains how to determine if a company may go bankrupt using the deb
From playlist Stocks and Bonds

Excel Finance Class 17: Leverage & Solvency Ratios: Debt To Equity, Equity Multiplier, more...
Download Excel File: https://people.highline.edu/mgirvin/YouTubeExcelIsFun/Busn233Ch03.xls Download pdf notes: https://people.highline.edu/mgirvin/YouTubeExcelIsFun/BUSN233cH03-16PAGES.pdf Download 2nd Excel File: https://people.highline.edu/mgirvin/YouTubeExcelIsFun/Busn233Ch03DaysInCashC
From playlist Excel Finance Free Course at YouTube. Cash Flow Analysis and Model Building (110 Videos).

How Fast US Debt is Increasing VISUALIZED Over 1 Minute
This is how quickly the US national debt is rising in real-time, over 1 minute. Currently, it totals over $30 trillion. $1.5 MILLION every minute, $25,000 per second.
From playlist Concerning Finance
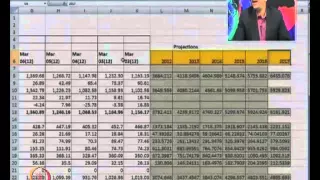
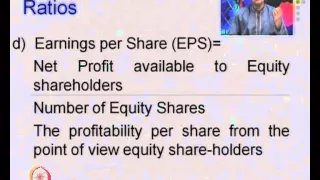
Mod-07 Lec-18 Financial Statements Analysis - Dabur India Case
Managerial Accounting by Dr. Varadraj Bapat,Department of Management,IIT Bombay.For more details on NPTEL visit http://nptel.ac.in
From playlist IIT Bombay: Managerial Accounting | CosmoLearning.org Accounting


Build With Magnimetrics: Debt Covenants Tutorial [Free FP&A Software]
Grab your FREE Magnimetrics account here: https://app.magnimetrics.com/auth/signup Download Source Files here: https://magnimetrics.com/wp-content/uploads/2022/01/Company-Financials_CY2018-CY2020.xlsx https://magnimetrics.com/wp-content/uploads/2022/01/Company-Financials_CY2021-CY2022.xls
From playlist Learn Magnimetrics
Managerial Accounting by Dr. Varadraj Bapat,Department of Management,IIT Bombay.For more details on NPTEL visit http://nptel.ac.in
From playlist IIT Bombay: Managerial Accounting | CosmoLearning.org Accounting

Excel Finance Class 20: Growth Ratios and Market Value Ratios
Download Excel File: https://people.highline.edu/mgirvin/YouTubeExcelIsFun/Busn233Ch03.xls Download pdf notes: https://people.highline.edu/mgirvin/YouTubeExcelIsFun/BUSN233cH03-16PAGES.pdf Download 2nd Excel File: https://people.highline.edu/mgirvin/YouTubeExcelIsFun/Busn233Ch03DaysInCashC
From playlist Excel Finance Free Course at YouTube. Cash Flow Analysis and Model Building (110 Videos).

Scikit Learn Machine Learning for investing Tutorial with Python p. 4
In this tutorial, we cover many of the concepts required for how we're going to handle our data set for machine learning. We then cover some basic code regarding how we can pull specific data points out of the file. Data download: http://pythonprogramming.net/static/downloads/machine-lea
From playlist Scikit-learn Machine Learning with Python and SKlearn

In this video, we look at an example of finding equity in a home.
From playlist Personal Finance