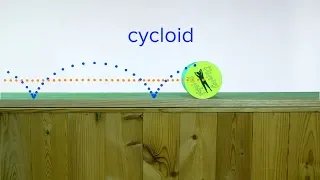
#Cycloid: A curve traced by a point on a circle rolling in a straight line. (A preview of this Sunday's video.)
From playlist Miscellaneous

Philipp Grohs: Wavelets, shearlets and geometric frames - Part 2
Find this video and other talks given by worldwide mathematicians on CIRM's Audiovisual Mathematics Library: http://library.cirm-math.fr. And discover all its functionalities: - Chapter markers and keywords to watch the parts of your choice in the video - Videos enriched with abstracts, b
From playlist Analysis and its Applications
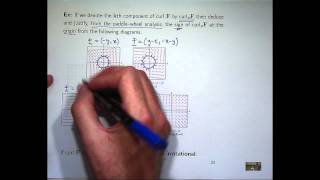
Free ebook http://tinyurl.com/EngMathYT A basic introduction to the curl of a vector field - one of the basic operations of vector calculus. I show how to calculate the curl and discuss its relationship with rotation and circulation density. Many examples are presented.
From playlist Engineering Mathematics

Philipp Grohs: Somes perspectives of computational harmonic analysis in numerics
Find this video and other talks given by worldwide mathematicians on CIRM's Audiovisual Mathematics Library: http://library.cirm-math.fr. And discover all its functionalities: - Chapter markers and keywords to watch the parts of your choice in the video - Videos enriched with abstracts, b
From playlist 30 years of wavelets

Deep learning for scientific computing: 2 stories on the gap between theory & practice - Ben Adcock
Deep learning is being increasingly used for challenging problems in scientific computing. Theoretically, such efforts are supported by a large and growing body of literature on existence of deep neural networks with favourable approximation properties. Yet, these results often say very li
From playlist Interpretability, safety, and security in AI

Lisbeth Fajstrup interviewed by Martin Raussen (September 29, 2021)
Lisbeth Fajstrup interviewed by Martin Raussen (September 29, 2021) For more on the interview series, along with the advertisement posters, please see https://sites.google.com/view/aatrn/interviews
From playlist AATRN Interviews
Ingrid Daubechies - 4/4 Time-Frequency Localization and Applications
Abstract: In this 250th anniversary year of the birth of Joseph Fourier, it behoves us to talk of frequency and spectral analysis! The lectures shall visit a number of different techniques that have been developed and applied in the last 30 years, to carry out what engineers and applied m
From playlist Hadamard Lectures 2018 - Ingrid DAUBECHIES - Time-Frequency Localization and Applications

Ingrid Daubechies - 1/4 Time-Frequency Localization and Applications
Abstract: In this 250th anniversary year of the birth of Joseph Fourier, it behoves us to talk of frequency and spectral analysis! The lectures shall visit a number of different techniques that have been developed and applied in the last 30 years, to carry out what engineers and applied m
From playlist Hadamard Lectures 2018 - Ingrid DAUBECHIES - Time-Frequency Localization and Applications
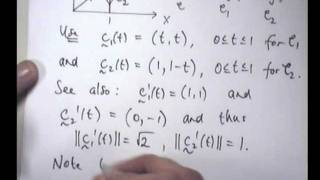
Free ebook http://tinyurl.com/EngMathYT How to integrate over 2 curves. This example discusses the additivity property of line integrals (sometimes called path integrals).
From playlist Engineering Mathematics

Ingrid Daubechies - 3/4 Time-Frequency Localization and Applications
Abstract: In this 250th anniversary year of the birth of Joseph Fourier, it behoves us to talk of frequency and spectral analysis! The lectures shall visit a number of different techniques that have been developed and applied in the last 30 years, to carry out what engineers and applied m
From playlist Hadamard Lectures 2018 - Ingrid DAUBECHIES - Time-Frequency Localization and Applications
From playlist Drawing a sphere

Ingrid Daubechies - 2/4 Time-Frequency Localization and Applications
Abstract: In this 250th anniversary year of the birth of Joseph Fourier, it behoves us to talk of frequency and spectral analysis! The lectures shall visit a number of different techniques that have been developed and applied in the last 30 years, to carry out what engineers and applied m
From playlist Hadamard Lectures 2018 - Ingrid DAUBECHIES - Time-Frequency Localization and Applications

(ML 7.7.A1) Dirichlet distribution
Definition of the Dirichlet distribution, what it looks like, intuition for what the parameters control, and some statistics: mean, mode, and variance.
From playlist Machine Learning
What are the x and y intercepts of a linear equation
👉 Learn about graphing linear equations. A linear equation is an equation whose highest exponent on its variable(s) is 1. i.e. linear equations has no exponents on their variables. The graph of a linear equation is a straight line. To graph a linear equation, we identify two values (x-valu
From playlist ⚡️Graph Linear Equations | Learn About
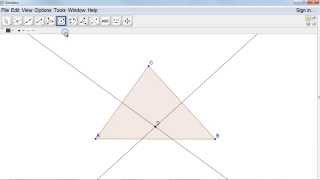
Quickstart for Desktop Version Example 1: Circumcircle of a Triangle
From playlist Quickstart for Desktop

Linear Equations from the Graph of the Line, No. 1
Shows how to write the equation of a line in the slope intercept from from the graph of the line. You can link to all my videos at my website: https://www.stepbystepscience.com
From playlist Algebra; Linear Equations
In this video I take a look at the slope of a curve (that is not straight line).
From playlist Biomathematics

Artificial Intelligence Full Course in 10 Hours [2023] | Artificial Intelligence Tutorial | Edureka
🔥 𝐌𝐚𝐜𝐡𝐢𝐧𝐞 𝐋𝐞𝐚𝐫𝐧𝐢𝐧𝐠 𝐄𝐧𝐠𝐢𝐧𝐞𝐞𝐫 𝐌𝐚𝐬𝐭𝐞𝐫𝐬 𝐏𝐫𝐨𝐠𝐫𝐚𝐦 : https://www.edureka.co/masters-program/machine-learning-engineer-training (Use Code "𝐘𝐎𝐔𝐓𝐔𝐁𝐄𝟐𝟎") This Edureka video on "Artificial Intelligence Full Course" will provide you with a comprehensive and detailed knowledge of Artificial Intelligence
From playlist Artificial Intelligence Tutorial For Beginners | Edureka

What is everything you need to know to graph an equation in slope intercept form
👉 Learn about graphing linear equations. A linear equation is an equation whose highest exponent on its variable(s) is 1. i.e. linear equations has no exponents on their variables. The graph of a linear equation is a straight line. To graph a linear equation, we identify two values (x-valu
From playlist ⚡️Graph Linear Equations | Learn About